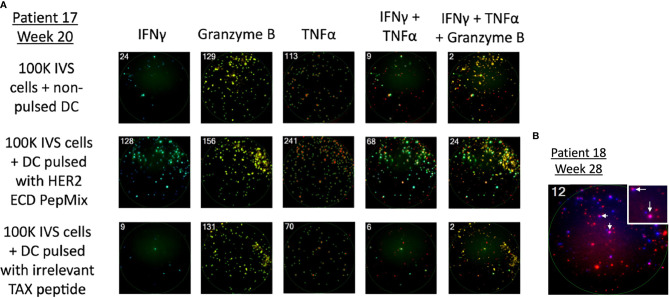
Figure 4.
Detection of cellular response against HER2 after vaccination using the FluoroSpot assay. PBMCs were stimulated in the presence of a HER2 peptide mix and measured for the production of IFN-γ, granzyme B, TNF-⍺, and their combinations. (A) Representative image of the assay on PBMCs of patient 17 who had complete regression of the lesion after vaccination. The first row is without antigen presentation, the second row is HER2 presented via DCs in vitro, and the third row shows cells stimulated by an irrelevant peptide. HER2-stimulated cells show a marked increase in spot numbers compared with control rows. (B) Representative image of the assay detecting multifunctional lymphocyte response. Taken from patient 18 who received the vaccine as an adjuvant after standard treatment for high-risk muscle-invasive bladder cancer when there was no detectable tumor in imaging studies. The number in the left upper corner indicates positive spots (cells) per well; IFN-γ (blue) and TNF-α (red); dual positive cells (pink) were marked with arrows.

