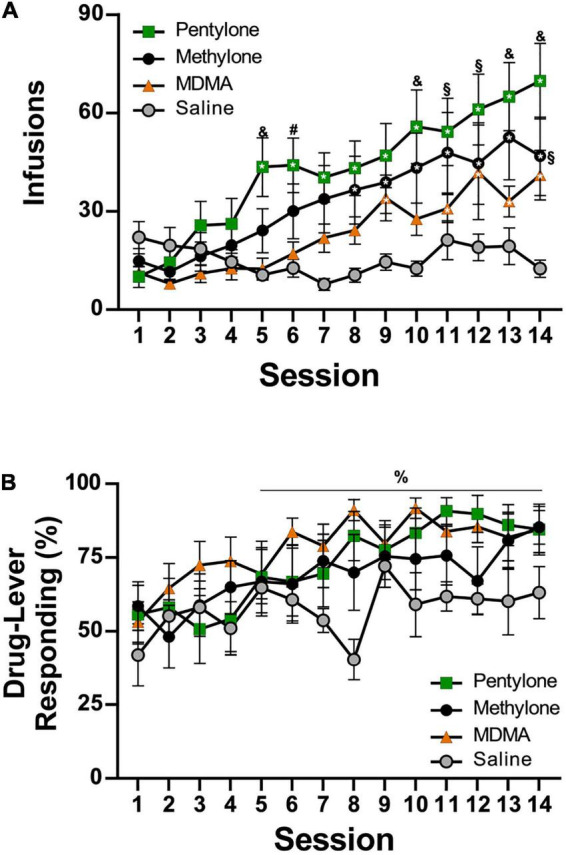
FIGURE 2.

(A) Mean (±S.E.M.) infusions of Pentylone (N = 12), Methylone (N = 10), MDMA (N = 13), and saline (N = 8; Vehicle) obtained under extended access conditions. (B) Mean (±S.E.M.) percent of responses on the drug-associated lever. A significant difference from the first session, within group, is indicated with *, a significant difference from the first session, collapsed across groups, with%, a difference from the Vehicle and MDMA groups with &, a difference from the Vehicle group with §, and a difference from the MDMA group with #.
