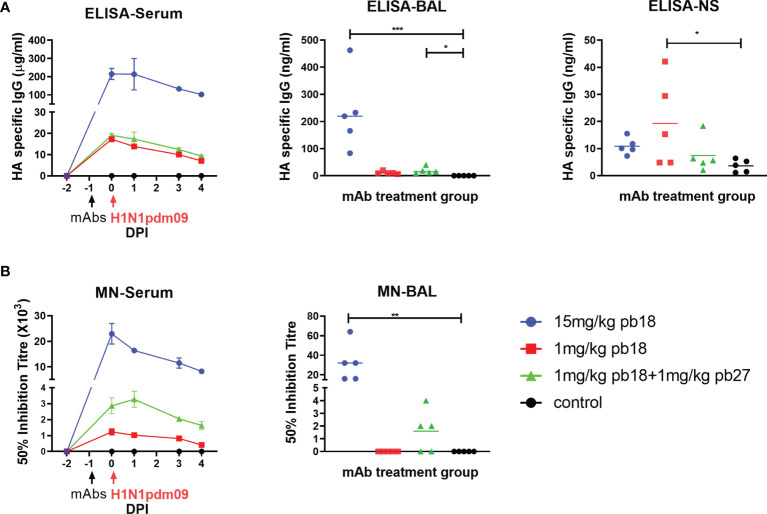
Figure 3.
Concentration and neutralization titers of mAbs in serum, BAL and nasal swabs. HA specific IgG in sera was assessed by ELISA at the indicated DPI and in BAL and nasal swabs (NS) at 4 DPI (A). The 50% neutralization titers against H1N1pdm09 in sera at the indicated timepoints and in BAL at 4 DPI are shown (B). The time course plots (serum) show the mean (line) and SEM (error bars) for each group of five pigs. The dot plots (BAL and NS) show the data for individual pigs with a group and the horizontal line shows the mean for the group. Data were analyzed using a Kruskal–Wallis test with Dunn’s multiple comparison test. Asterisks denote significant differences *p <0.05, **p <0.01, ***p <0.001 versus control.

