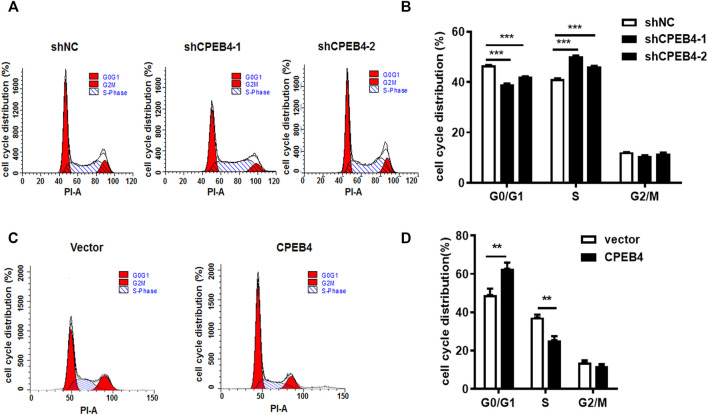
FIGURE 4.
CPEB4 induces G1 cell cycle arrest. (A,B) Cell cycle distribution was measured by flow cytometry in ACHN cells with CPEB4 stable knockdown. (C,D) Cell cycle distribution was measured by flow cytometry in 786O cells with CPEB4 stable overexpression. Indicated cells were starved in medium containing no serum for 48 h, after which they were released into complete growth medium for 24 h. After release the cells were harvested and analyzed by flow cytometry. The dataset of (A, C) is representative example of triplicate experiments. Column graph of (B,D) was mean ± SD of three independent experiments.

