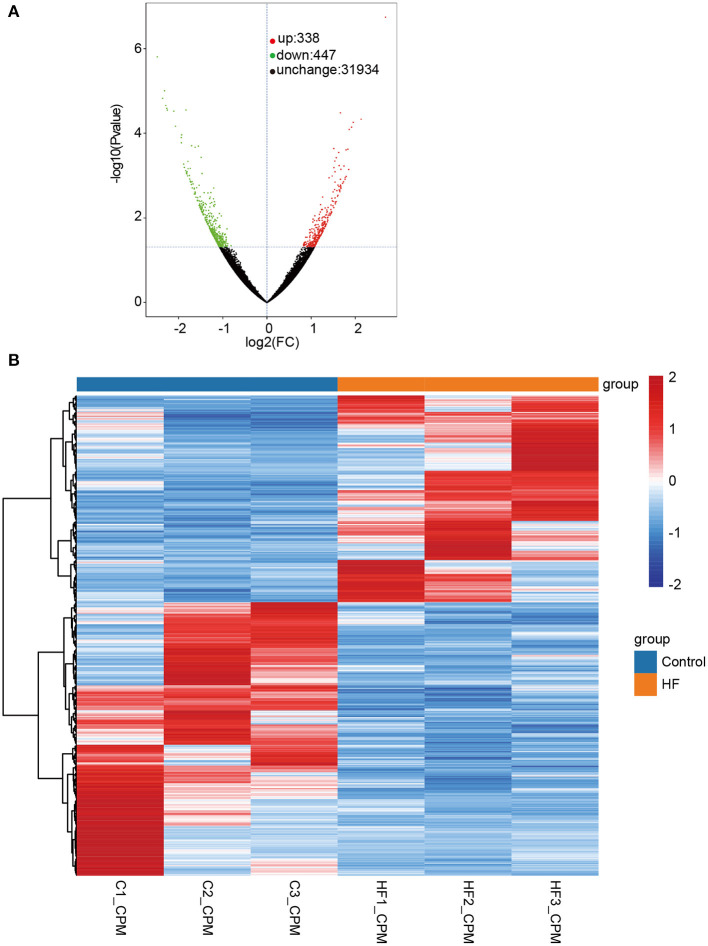
Figure 3.
Differentially expressed transcripts (DETs) between HF dogs and controls. (A) Volcano plot of DETs. Green represents the downregulated DETs, red represents the upregulated DETs, and black represents the non-differential expression. (B) Heatmap of the DETs expression levels in HF dogs and controls. Red and blue represent up- and downregulated DETs, respectively. HF, heart failure; C, controls; FC, fold change.

