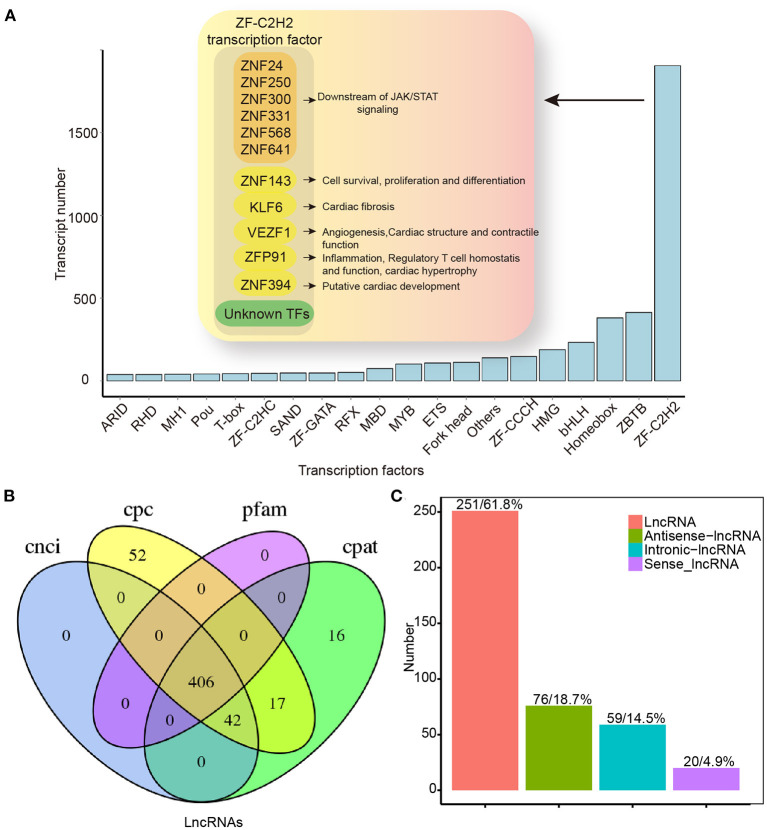
Figure 7.
Transcription factors and lncRNAs analysis by full-length transcriptome sequencing. (A) TF distribution presenting information for only the top 20 TF families. (B) Venn map for the number of lncRNAs identified by CNCI, CPC, CPAT, and Pfam database. (C) LncRNAs positional classification. CPC, coding potential calculator; CNCI, coding–non-coding index; CPAT, coding potential assessment tool; CPM, counts per million; lncRNAs, long non-coding RNAs; TF, transcription factor.

