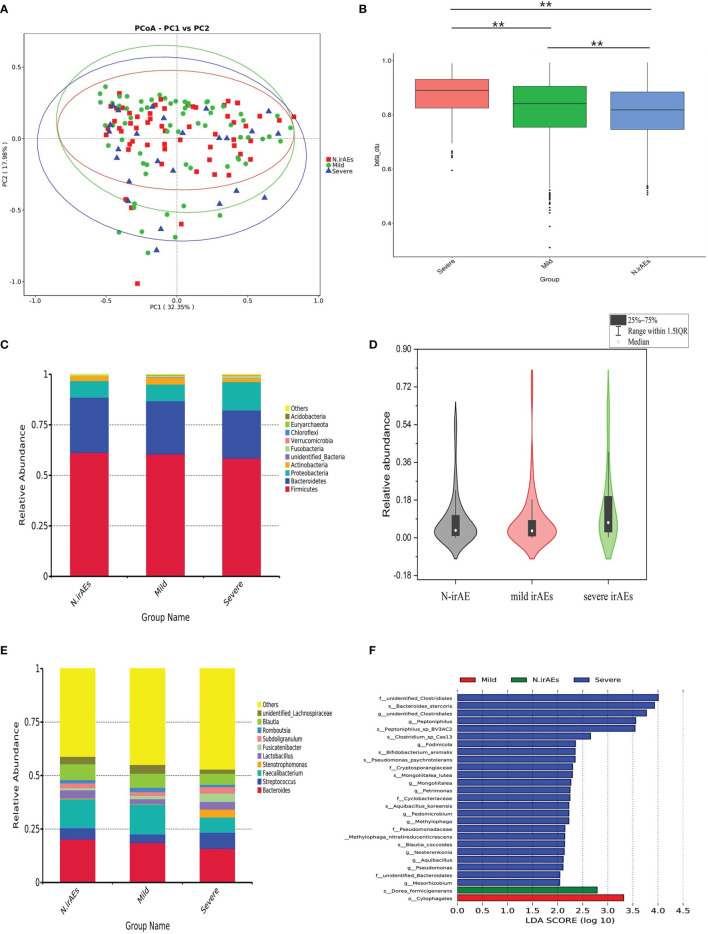
Figure 2.
Gut microbiome composition for all patients stratified by irAEs. (A) PCoA test was used to measure the shift in intestinal bacterial composition profile among groups. (B) Bacterial community dissimilarities among groups. Bray-Curtis distances were independently calculated for N-irAEs vs. mild irAEs. Statistical significance was determined by the Mann-Whitney U test. ** p < 0.001. (C) Phylogenetic composition of the top 10 bacterial taxa at the phylum level, ordered by the most abundance taxa across the cohort. (D) Relative abundance of Proteobacteria in the phylum level. Statistical differences were assessed by Wilcoxon test. (E) Phylogenetic composition of common bacterial taxa at the genus level, ordered by the most abundance taxa across the cohort. (F) Differential abundance analysis using LEfSe stratified according to the occurrence of irAEs. Note that all findings reported on LEfSe are statistically significant. LDA, linear discriminant analysis.

