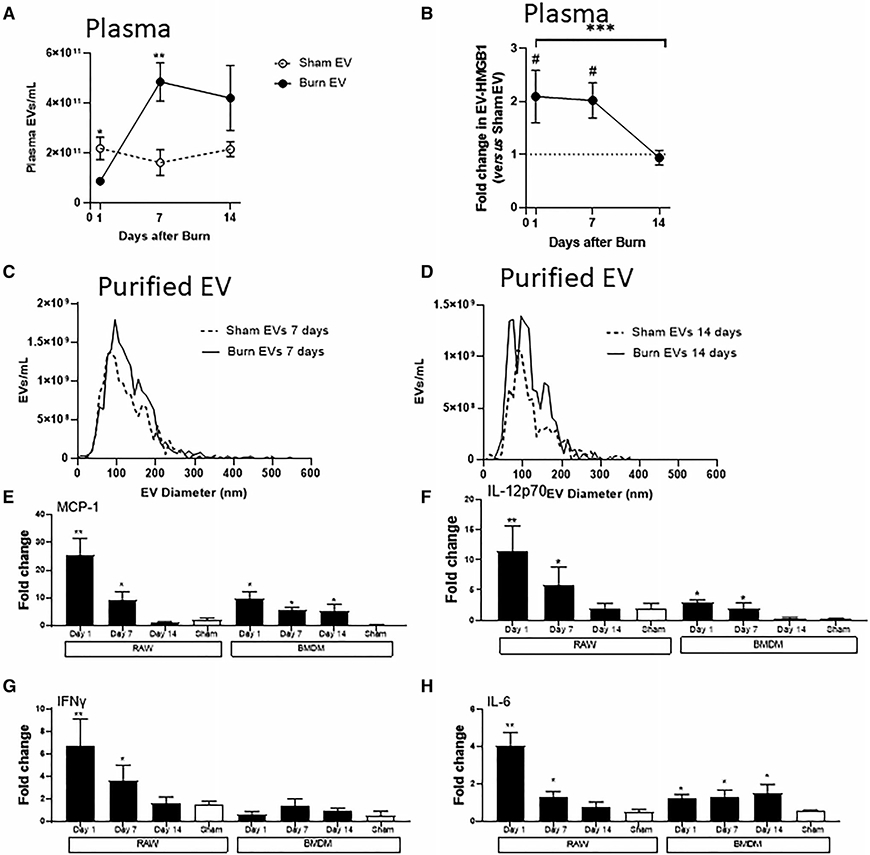
FIGURE 5. Extracellular vesicles (EVs) isolated after burn injury induce altered cytokine secretion patterns bymacrophages in vitro.

Mice underwent 20% total body surface area (TBSA) burn injury or sham injury, and blood harvested at days 1, 7, and 14 after injury. Burn mice had significantly different concentrations or EVs as determined by nanoparticle tracking analysis (NTA) (A), and high-mobility group protein 1 (HMGB1) cargo (B), as determined by ELISA vs. shammice (C) (data represent n = 6 mice per time point, ±SEM; A) *P < 0.05, **P < 0.01 by Mann-Whitney unpaired nonparametric t-test and B) ***P < 0.0005 by Mann-Whitney unpaired nonparametric t-test day 1 vs. day 14 burn EV, and ###P < 0.0005 by Mann-Whitney unpaired nonparametric t-test day 7 vs. sham EV). NTA analysis was to use to measure size distribution (i.e., diameter) after purification from plasma. EVs isolated from plasma (C) 7 d or (D) 14 d after burn or sham injury showed similar size distributions compared to sham EV controls. (E–G) Equivalent numbers of EVs (3 × 10⁷) isolated from sham-injured (white bars) and burn-injured (black bars) mice at each time point after burn injury were added to 1 × 10⁶ adhered RAW264.7 or bone marrow-derived macrophages (BMDMs) for 24 h (each bar represents 12 source mice, with n = 6 different pooled EV preparations from 2 individual mice). Supernatant cytokinesMCP-1, IL-6, IFNγ, and IL-12p70 were measured by Bio-Plex multiplex analysis. Data shown ± SEM; *P < 0.05, **P < 0.01 by Mann-Whitney unpaired nonparametric t-test
