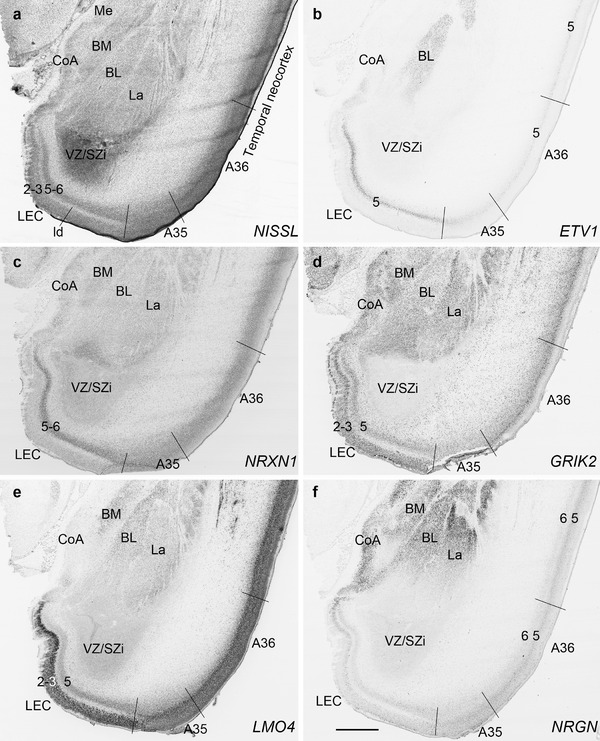
FIGURE 11.

Gene expression in lateral entorhinal cortex (LEC), perirhinal area 35 (A35), and amygdala at PCW 21. (a) A Nissl‐stained section showing the cytoarchitecture in the LEC, A35, and amygdaloid nuclei. (b‐f) Expression patterns of ETV1 (b), NRXN1 (c), GRIK2 (d), LMO4 (e), and NRGN (f) in the LEC, A35, and amygdaloid nuclei. Note that the borders of A35 with LEC and temporal neocortical area 36 (A36) can be identified based on gene expression difference. A35 displays overall lower expression of ETV1 (b), NRXN1 (c), and GRIK2 (d) than LEC and A36. Subtle difference could also be noted at the border between A36 and more dorsally located temporal cortex with less expression of ETV1 (b), GRIK2 (d), and NRGN (f) in A36. Scale bar: 1590 μm in (f) for all panels
