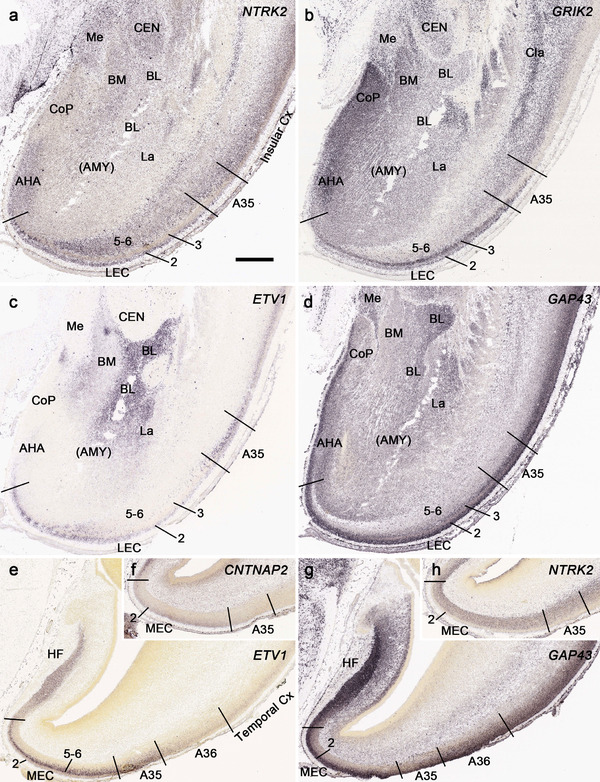
FIGURE 13.

Identification of LEC, MEC, and areas 35 and 36 at PCW15. The borders of these four areas can be identified based on combined gene expression patterns. Strong expression of NTRK2 (a), GRIK2 (b), ETV1 (c), and GAP43 (d) is observed in layer 2 of the LEC. In contrast, ETV1 (e) and NTRK2 (h) are not expressed in layer 2 of the MEC. Layer 2 in both LEC and MEC expresses GAP43 (d, g). The borders of A35 with the EC (LEC and MEC) and A36 can also be appreciated on the base of combined gene expression patterns. At the anterior level (a‐d), GRIK2 is strongly and weakly expressed in layers 2–3 of the LEC and A35, respectively (b) and the reverse is true for ETV1 expression (c). At the posterior level (e‐h), clear and faint CNTNAP2 expression is observed in layer 2 of the MEC and A35, respectively (f). The border between A35 and A36 can be identified based on ETV1 expression since strong and faint expression exists in A35 and A36, respectively (e). The density and intensity of ETV1 expression is lower in A36 than in the lateral neocortex (e)
