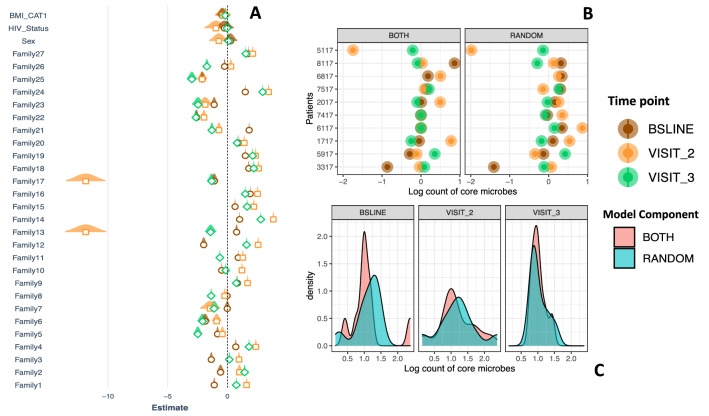
Figure 7.
Analysis of microbial-abundance. (A) Depicts change in abundance across the treatment period accounting for BMI, HIV status and gender. Brown, orange and green depict months 0 (baseline), 2 and 3, respectively. (B) depict the variance attributed to an individual sample (random intercept of our mixed model) and that due to clinical variables (fixed component of the model), the latter was larger than the former, especially between months 0 (baseline) and 2 (C). This figure is based dataset C of Fig. 1.

