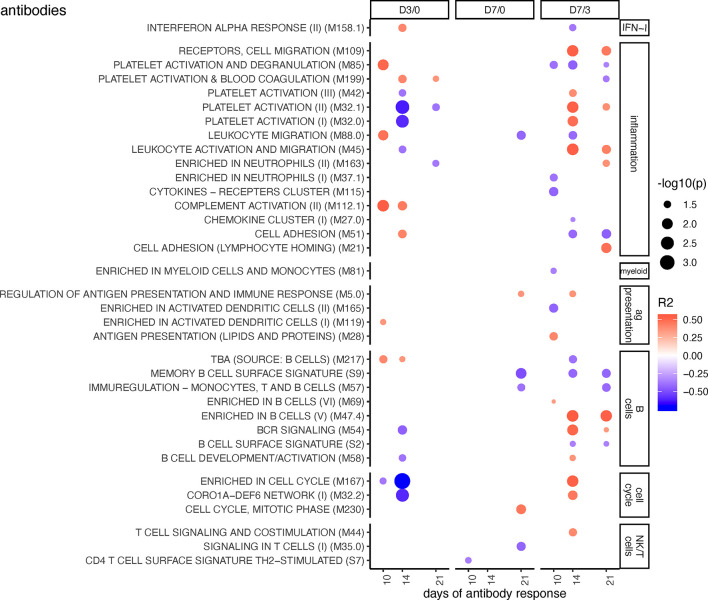
Figure 2.
BTM correlating with anti-PRRSV inhibitory antibody levels. Time-dependent single sample enrichment scores for BTM were correlated with the AUC (0–21 dpi) of anti-PRRSV inhibitory antibodies [data from (16)]. R squared correlation coefficients for the BTM changes from D3/0, D7/0, and D7/3 are indicated by the color gradient (red for positive values, blue for negative values). Increased circle sizes indicate smaller p values (cutoff < 0.05). BTMs were grouped in families (11).

