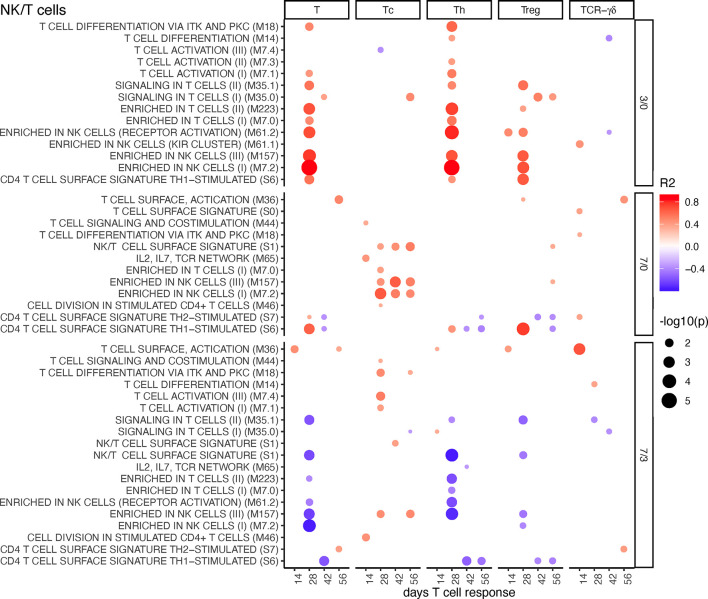
Figure 6.
T/NK cell BTM correlating with T-cell priming. Time-dependent single-sample enrichment scores for BTM were correlated with the proliferative recall response of total CD3+ T cells, Tc, Th, and TCR-γδ T-cells measured at 14, 28, 42, and 56 days after LP or HP PRRSV-2 infection [x-axis, data from (15)]. R squared correlation coefficients for the BTM changes from D3/0, D7/0, and D7/3 are indicated by the color gradient (red for positive values, blue for negative values). Increased circle sizes indicate smaller p values (cutoff < 0.05).

