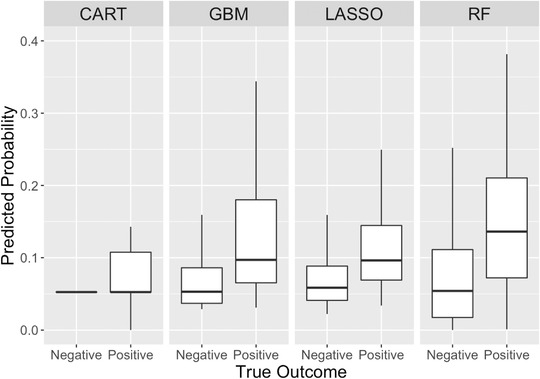
FIGURE 3.

Predicted probabilities of return hospital admission compared with true outcome for the 30% test set (n = 1669). CART, classification and regression tree; GBM, gradient boosted machine; LASSO, least absolute shrinkage and selection; RF, random forest
