Figure 1.

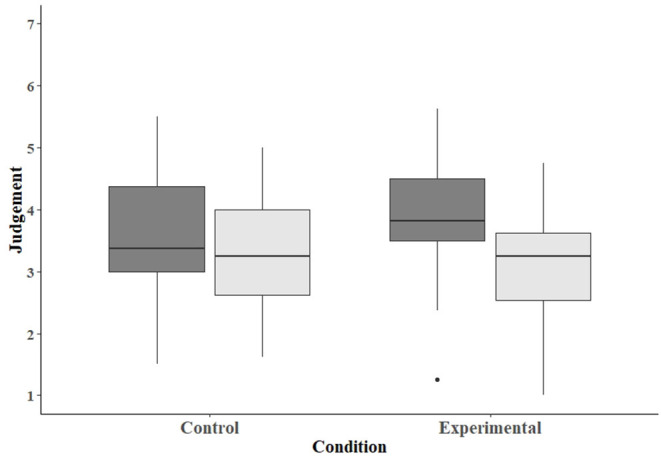
Box plot depicting the scores assessing tendencies of participants in the control and experimental conditions to judge clients. Dark-gray bars represent scores on the pretest, and light-gray bars scores on the post-test.

Box plot depicting the scores assessing tendencies of participants in the control and experimental conditions to judge clients. Dark-gray bars represent scores on the pretest, and light-gray bars scores on the post-test.