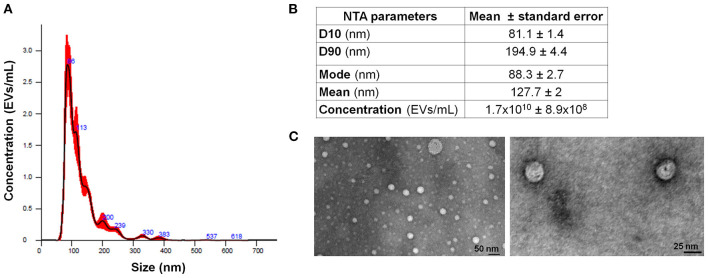
Figure 1.
MM-EV characterization. (A) Representative histogram of hydrodynamic EV size distribution profile from RPMI 8226 cell line measured by NTA. (B) NTA data are expressed as D10, D90, mode, mean, and concentration of MM-derived EVs as mean value ± Standard Error. (C) Representative photos of MM cell line-derived EVs obtained by TEM (image magnification: 100 and 160 KX, respectively). The horizontal bar indicates 50 and 25 nm, respectively. MM, multiple myeloma; EVs, Extracellular vesicles; NTA, Nanoparticle Tracking Analysis.

