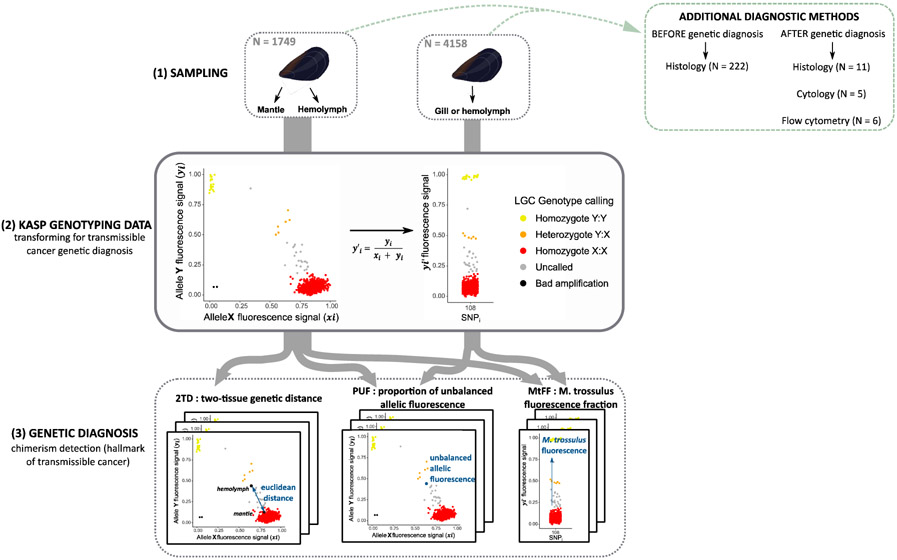
Fig. 2: Experimental design diagram, from sampling to genetic diagnosis.
(1) Mussel sampling. 1749 individuals double sampled on hemolymph and mantle and 4158 individuals only sampled on gill or hemolymph. The additional diagnostic methods used are reported in the green box (see Table S3). (2) Transformation of KASP genotyping data for transmissible cancer detection. Example of KASP fluorescence data plot (left) and the transformed fluorescence value y’i for the bi-allelic SNP “108” (right). This SNP is diagnostic and allele Y (yi) corresponds to the most frequent allele in M. trossulus reference samples (Table S2). Thus, homozygotes X:X (red) are M. edulis-M. galloprovincialis individuals while homozygotes Y:Y (yellow) are M. trossulus individuals. Heterozygotes Y:X (orange) are introgressed genotypes, healthy individuals with a trossulus-state allele at a locus due to shared polymorphism. Uncalled (grey) are M. edulis-M. galloprovincialis hosts with an excess of M. trossulus flurorescence likely due to M. trossulus transmissible cancer. Poor amplification (black) were removed from the analysis. (3) Genetic diagnosis, 3 indexes to detect genetic chimerism. Two-tissue genetic distance (2TD) calculated for double sampled mussels (n=1749). Proportion of unbalanced allelic fluorescence (PUF). M. trossulus fluorescence fraction (MtFF) computed from 10 diagnostic SNPs.

