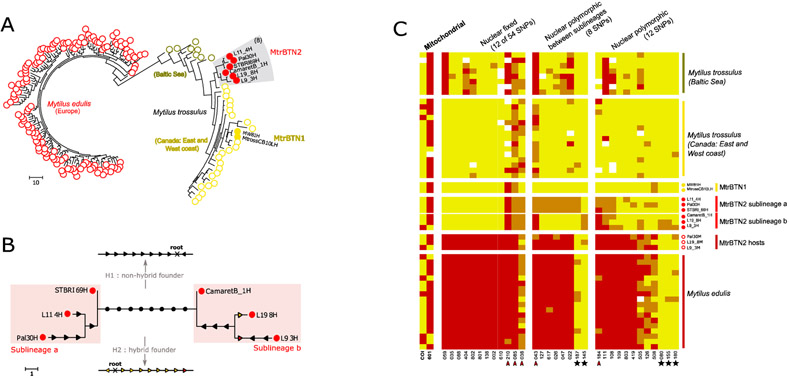
Fig. 5: MtrBTN2 tumor genotypes.
(A) Maximum parsimony tree estimated from 74 nuclear SNP genotypes of MtrBTN2 tumors (red filled circles), M. edulis individuals (red open circles), MtrBTN1 tumors (yellow filled circles), M. trossulus individuals from British Columbia (yellow open circles) and Batic Sea (dark yellow open circles). (B) Unrooted subtree of the 6 MtrBTN2 tumors. Mutations are reported and represent gain of heterozygosity (black arrow), loss of heterozygosity (colored arrow, yellow for mutation toward a trossulus-state allele and red toward an edulis-state allele). The founder (common ancestor) genotype being unknown, the 8 mutations separating the two lines (black circles) cannot be oriented without assumptions. We present two hypotheses: a non-hybrid founder (H1, all mutations are gain of heterozygosity) and a hybrid founder (H2, all mutations are loss of heterozygosity but mostly to trossulus-state allele). (C) Plot of genotypes for a subset of SNPs in columns and individuals in rows. Red: homozygote of edulis-state allele; yellow: homozygote of trossulus-state allele; orange: heterozygote. Individuals' origins are reported by circle type and color (see (A)) and only 17 of the M. edulis individuals are represented here. The first two columns correspond to mitochondrial SNPs, the twelve next to a subset of nuclear SNPs fixed in the 6 MtrBTN2 tumors, then eight SNPs fixed between the two sublineages and then 12 SNPs revealing polymorphism within each sublineages. Red arrowhead pointed the five SNPs with M. edulis-state allele excess in the 6 tumors. Black star highlights the five SNPs for which M.edulis-state allele in tumors are not explained by the null allele hypothesis. All individuals and SNPs are detailed in Figure S5.

