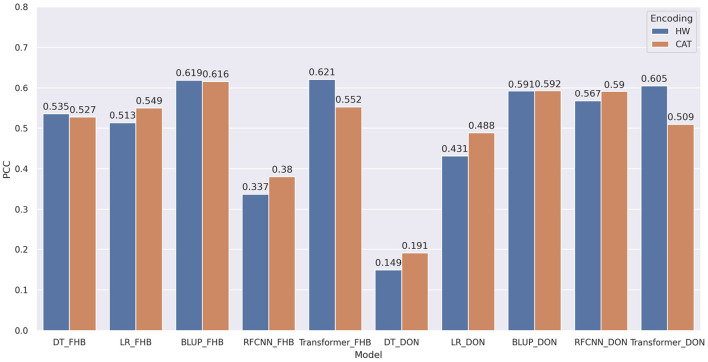
Figure 5.
Comparison of pearson correlation coefficient based on encoding techniques. HW and CAT represents Hardy-Weinberg and categorical encoding. The correlation is measured between the target and predicted phenotypes. decision tree, linear regression, BLUP, residual fully connected neural network and transformer are applied for each encoding technique.

