FIG. 1.
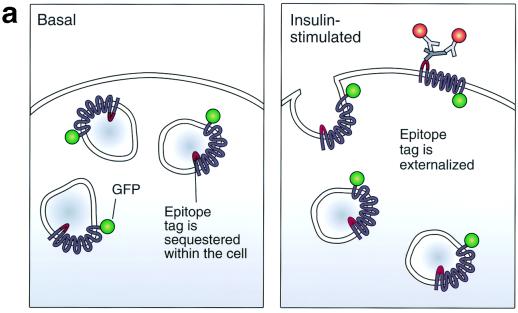
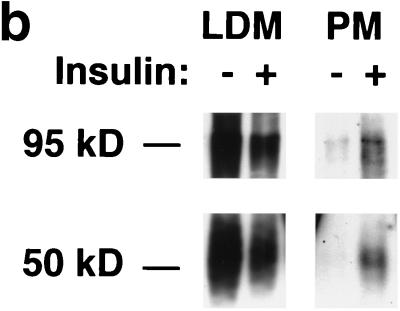
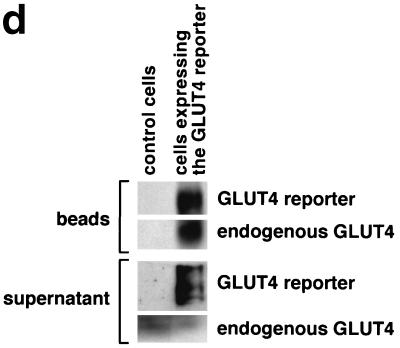
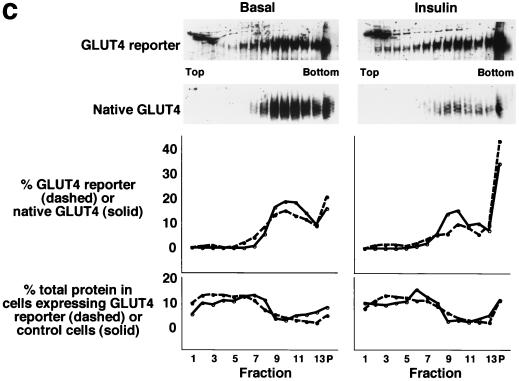
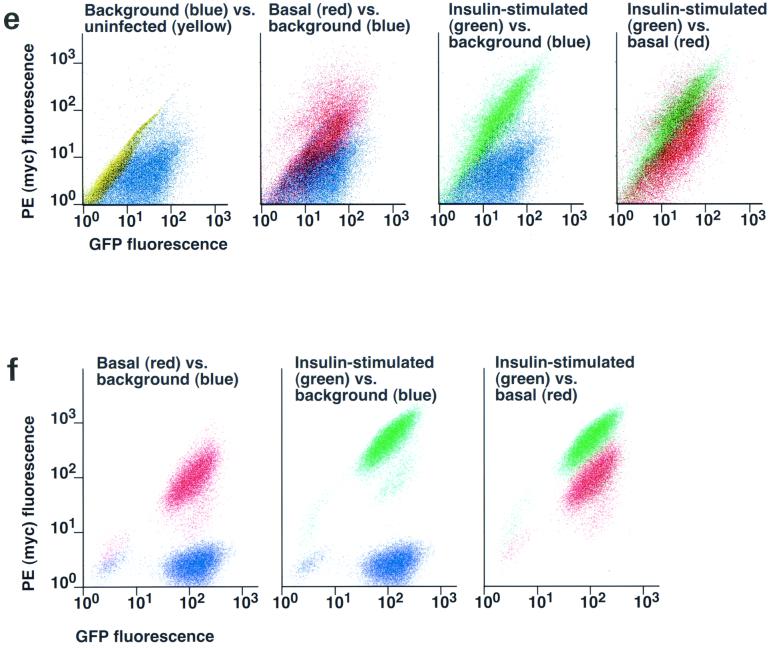
Assay for changes in proportion of GLUT4 at the plasma membrane. A GLUT4 reporter containing Myc epitope tags in the first exofacial loop as well as GFP fused in frame at the carboxy terminus was constructed as described in Materials and Methods. As shown in panel a, this reporter enables measurement of changes in the proportion of GLUT4 at the plasma membrane as changes in the ratio of fluorescence intensities corresponding to cell surface and total amounts of the reporter. Cell surface GLUT4 reporter is detected using an anti-Myc primary antibody and PE-conjugated secondary antibody. Total GLUT4 reporter is proportional to GFP fluorescence. (b) Low-density microsome (LDM) and plasma membrane (PM) fractions were isolated from 3T3-L1 adipocytes expressing the reporter and analyzed by SDS-PAGE and immunoblotting. Equal amounts of protein were loaded in each lane. Immunoblotting was done using an antibody directed against the carboxyl terminus of GLUT4 and demonstrates that both the reporter (95 kDa) and native GLUT4 (50 kDa) are redistributed from the LDM fraction to the PM after acute insulin treatment. The amount of translocation is quantitatively similar. (c) The LDM fractions from basal and insulin-stimulated 3T3-L1 adipocytes expressing the reporter and from control cells were further separated by sedimentation on a 10 to 30% linear sucrose gradient, as described in Materials and Methods. Equal volumes of each gradient fraction were analyzed by to determine total protein and by SDS-PAGE and immunoblotting to detect native GLUT4 (in control cells, using an anti-GLUT4 antibody) and the GLUT4 reporter (using an anti-Myc antibody). As shown in the top panels, the reporter and endogenous GLUT4 cosediment in both basal (left) and insulin-stimulated (right) cells. Densitometry was used to quantify the bands (middle panels), and data are plotted as the percentage of the total reporter or native GLUT4 present in each gradient fraction; these profiles are quite similar. As a control, the percentage of total protein present in each gradient fraction is plotted (lower panels); these profiles are similar to each other and distinct from those of the GLUT4 reporter and endogenous GLUT4. (d) LDM fractions from unstimulated 3T3-L1 adipocytes expressing the reporter and from control cells not expressing the reporter were used in vesicle immunopurification experiments. LDM fractions were incubated with two pooled anti-GFP monoclonal antibodies, followed by protein G-Sepharose beads. After pelleting and washing of the beads, the immunopurified material was eluted in sample buffer and analyzed by SDS-PAGE and immunoblotting with an anti-GLUT4 rabbit polyclonal antibody. As shown in the upper two panels, native GLUT4 is detected in the immunopurified material. The lower panels present a similar immunoblot of the supernatants and demonstrate that even though the immunopurification did not quantitatively remove all of the GLUT4 reporter, the endogenous GLUT4 is depleted, as expected. (e) Flow cytometry is used to quantify the insulin-stimulated change in the proportion of GLUT4 at the plasma membrane of 3T3-L1 adipocytes expressing the reporter protein. Serum-starved cells were treated or not with insulin, chilled, stained for externalized Myc epitope tag, and analyzed by FACS as described in Materials and Methods. PE and GFP fluorescence intensities are plotted on the vertical and horizontal axes, respectively, of the dotplots presented. Note that both scales are logarithmic. Compared to the background fluorescence of cells not expressing the reporter (yellow), cells expressing the reporter (blue) have increased GFP fluorescence (leftmost panel). Among cells expressing the reporter, unstained cells (blue) and basal (stained for cell surface Myc, shown in red) and insulin-stimulated (stained for cell surface Myc, shown in green) populations have progressively increasing PE fluorescence with no change in GFP fluorescence. Control experiments show that the background staining is negligible (not shown). The four panels allow direct comparison of pairs of samples. In this experiment, insulin caused a fourfold increase in the ratio of median fluorescence intensities attributable to externalized Myc epitope and to GFP expression, corresponding to a fourfold increase in the proportion of total GLUT4 present at the cell surface. (f) Flow cytometry was used to measure insulin-stimulated GLUT4 translocation in confluent CHO cells. As in panel e, PE fluorescence (proportional to cell surface GLUT4 reporter) is plotted on the vertical axis and GFP fluorescence (proportional to total GLUT4 reporter) is plotted on the horizontal axis; both scales are logarithmic. Background (unstained) cells expressing the reporter are shown in blue, and basal and insulin-stimulated populations are shown in red and green, respectively. The three panels allow direct comparison between each pair of samples. There is a minor population of unstained cells (blue) within the first decade of each scale; these cells do not express the GLUT4 reporter and conveniently demonstrate that the flow cytometer is properly adjusted to compensate for fluorophore bleedthrough. Compared to 3T3-L1 adipocytes, the background fluorescences (both PE and GFP) account for much less of the total fluorescence intensities in CHO cells, and the signal-noise ratio is correspondingly increased (compare panels e and f). In this experiment, insulin stimulated a 3.5-fold increase in the proportion of total GLUT4 present at the cell surface.

