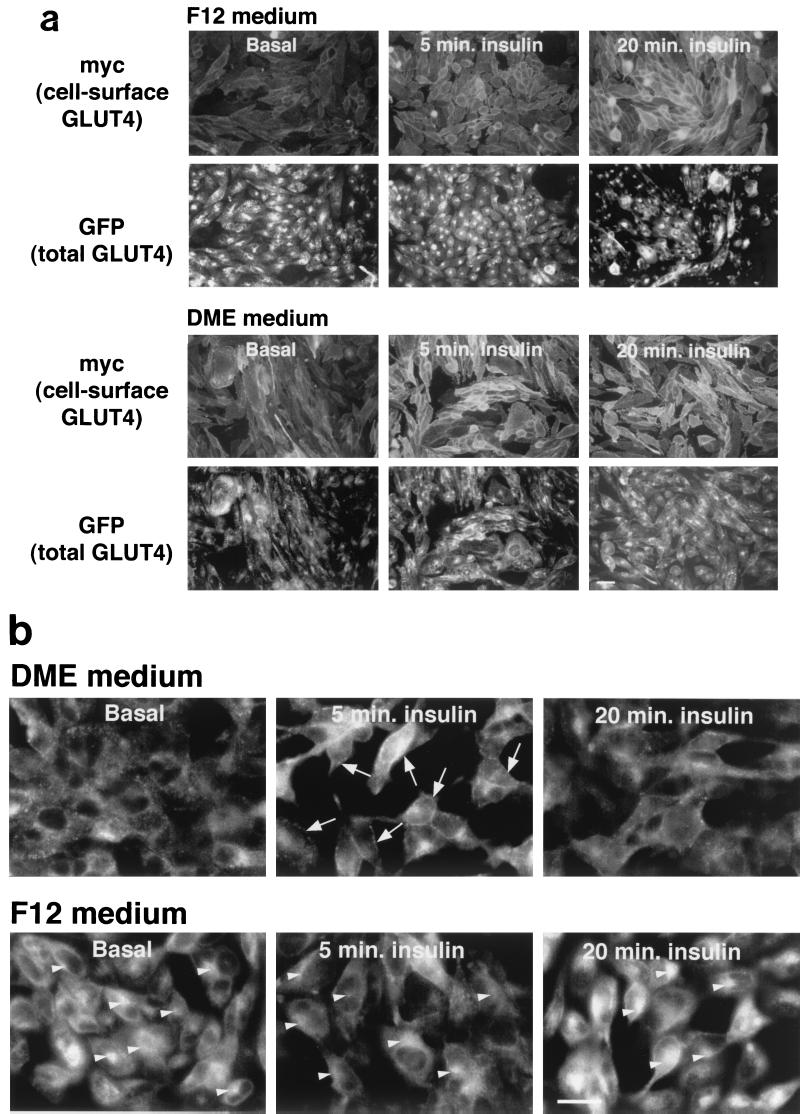
FIG. 6.
Culture conditions modulate the subcellular distribution of GLUT4 in CHO cells. CHO cells expressing the GLUT4 reporter were plated on coverslips, allowed to reach confluence, and then treated as described in the legend to Fig. 5. Two days before microscopy, cells were changed to DMEM or continued in F12 culture medium. On the day of microscopy, cells were serum starved for 3 h and then stimulated with 160 nM insulin for the times indicated. (a) Cells were chilled and stained without fixation or permeablization to detect externalized Myc epitope tag. A red (Alexa594-conjugated) secondary antibody was used, and the images are shown in the first (F12) and third (DMEM) rows. GFP was used to detect the total cellular GLUT4 reporter, and images are shown in green in the second (F12) and fourth (DMEM) rows. Cells cultured in F12 medium have the greatest amount of GLUT4 at the cell surface at 20 min, whereas those cultured in DMEM have more at the cell surface at 5 min. Scale bar, 10 μm. (b) The subcellular distribution of the GLUT4 reporter is more closely examined. These cells were fixed, permeablized, and stained with anti-Myc antibody and a FITC-conjugated secondary antibody in order to increase the total green fluorescent signal, which is then due to the combination of GFP and FITC. In cells cultured in F12, there is prominent staining of the GLUT4 reporter in the perinuclear region; this does not change significantly with short-term insulin treatment (bottom panels, arrowheads). In contrast, the GLUT4 reporter is absent from the perinuclear region in unstimulated cells cultured in DMEM and is present more prominently in punctate, peripheral structures (top left panel). Insulin treatment for 5 min results in a dramatic accumulation of GLUT4 at the plasma membrane in the cells cultured in DMEM (top center panel, arrows). In contrast, cells cultured in F12 medium have much less plasma membrane GLUT4 after 5 min of insulin treatment (bottom center panel). By 20 min after insulin addition, plasma membrane GLUT4 is similar in cells cultured in the two culture media (top right and bottom right panels) and is less prominent than at 5 min in the cells cultured in DMEM (compare to top center panel). The changes observed at the plasma membrane by microscopy correlate well with those quantified by flow cytometry (Fig. 5). Additionally, microscopy demonstrates that when the cells are cultured in DMEM rather than F12 medium, GLUT4 is distributed away from the perinuclear region and into punctate structures in the periphery. Scale bar, 10 μm.

