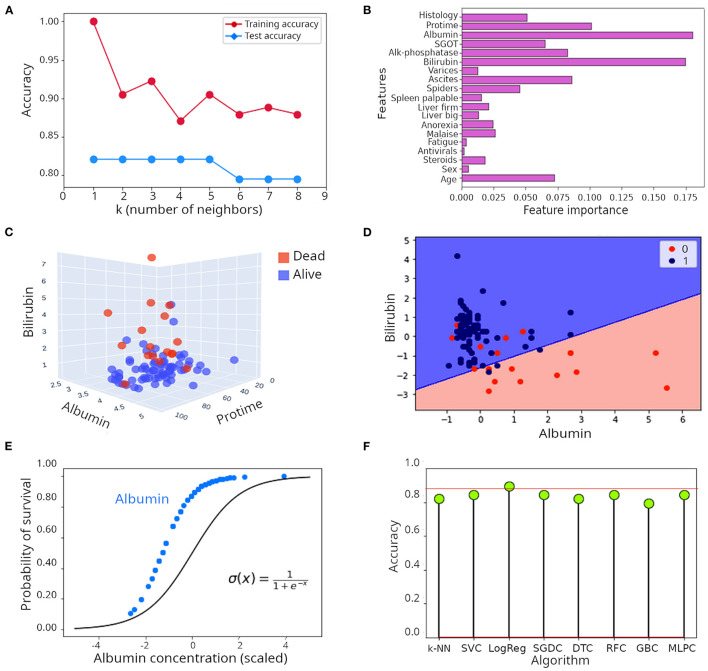
Figure 2.
Illustration of supervised learning algorithms. (A) Relationship between number of neighbors (k) and accuracy in the k-NN algorithm when applied to the hepatitis dataset. (B) Feature importance when the random forest algorithm was applied to the hepatitis dataset. (C) Tri-dimensional scatter plot of values of albumin, bilirubin and protime in patients included in the hepatitis dataset. (D) Decision surface of the logistic regression model applied to the hepatitis dataset illustrated in a two dimensional plot including only albumin and bilirubin. (E) Comparison of the theoretical probability distribution of a logistic regression model with the probability distribution of survival of patients in the hepatitis dataset when only albumin is considered as regressor. (F) Lollipop plot of accuracy achieved during classification of survival in the hepatitis dataset. k-NN, k nearest network; SVC, Support vector classifier; LogReg, Logistic regression (R squared); SGDC, Stochastic gradient descent classifier; DTC, Decision tree classifier; RFC, Random forest classifier; GBC, Gradient boosting classifier; MLPC, Multilayer perceptron classifier.

