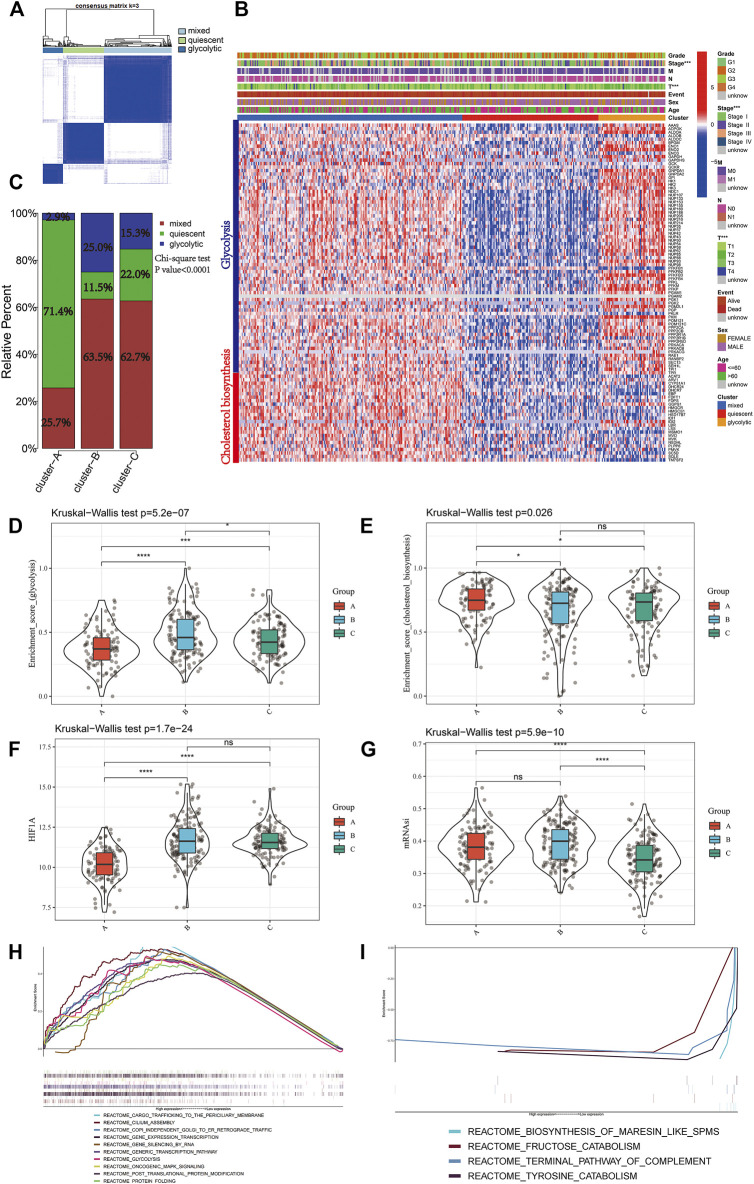
FIGURE 4.
Identify different metabolic subtypes (A) Consensus matrices of the TCGA cohort for k = 3 (B) Unsupervised clustering of total 97 genes from the cholesterol biosynthesis and glycolysis gene sets in TCGA cohorts to classify patients into different subtypes (mixed, quiescent, and glycolytic). Grade, stage, gender, survival status and age were utilized as patient annotations (C) The proportion of metabolic subtypes in the three mitophagy subtypes. Mixed subtype, red; quiescent subtype, green; glycolytic subtype, blue. The enrichment score of glycolysis (D) and cholesterol biosynthesis (E) gene sets between the different mitophagy subtypes in TCGA LIHC (F) Differences in HIF1A expression level among three mitophagy subtypes in TCGA LIHC cohort (G) Differences in mRNAsi score among three mitophagy subtypes in TCGA LIHC cohort. The KruskalWallis test was used to compare the statistical difference between three subtypes. GSEA results enriched in cluster A (H) and cluster B (I). The asterisks represented the statistical p value (*p < 0.05; **p < 0.01; ***p < 0.001; ****p < 0.0001).

