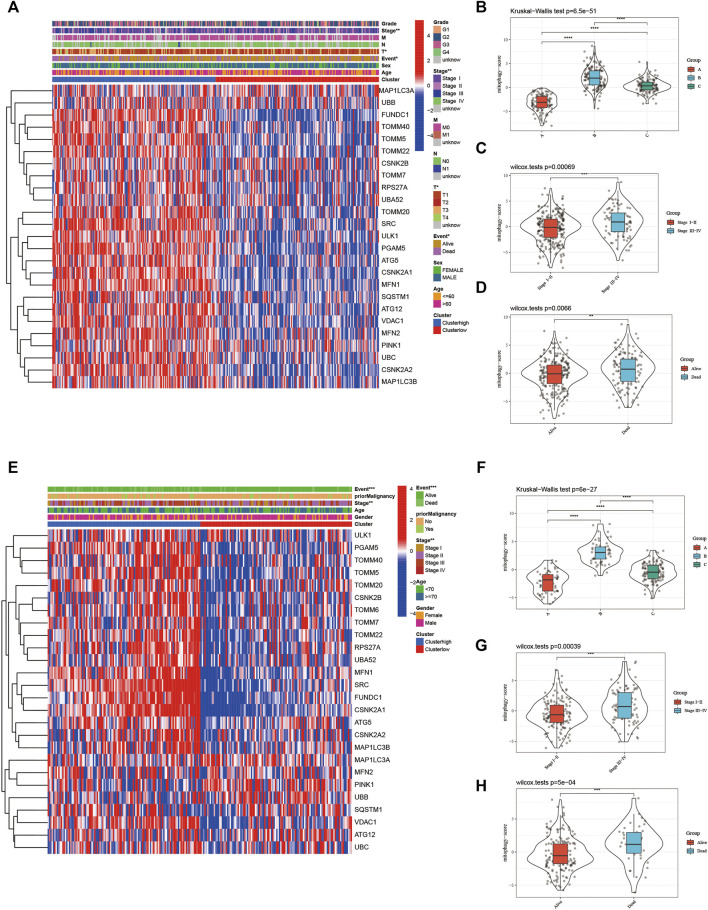
FIGURE 6.
(A) The heatmap of gene expression in the high-risk group versus low-risk group for the mitophagy regulators in TCGA LIHC cohort. Violin plot of different mitophagyscores between different mitophagy subtypes (B), stages (C) and survival status (D) of TCGA LIHC cohort (E) The heatmap of gene expression in the high-risk group versus low-risk group for the mitophagy regulators in ICGC cohort. Violin plot of different mitophagyscores between different mitophagy subtypes (F), stages (G) and survival status (H) of ICGC cohort. The asterisks represented the statistical p value (*p < 0.05; **p < 0.01; ***p < 0.001; ****p < 0.0001).

