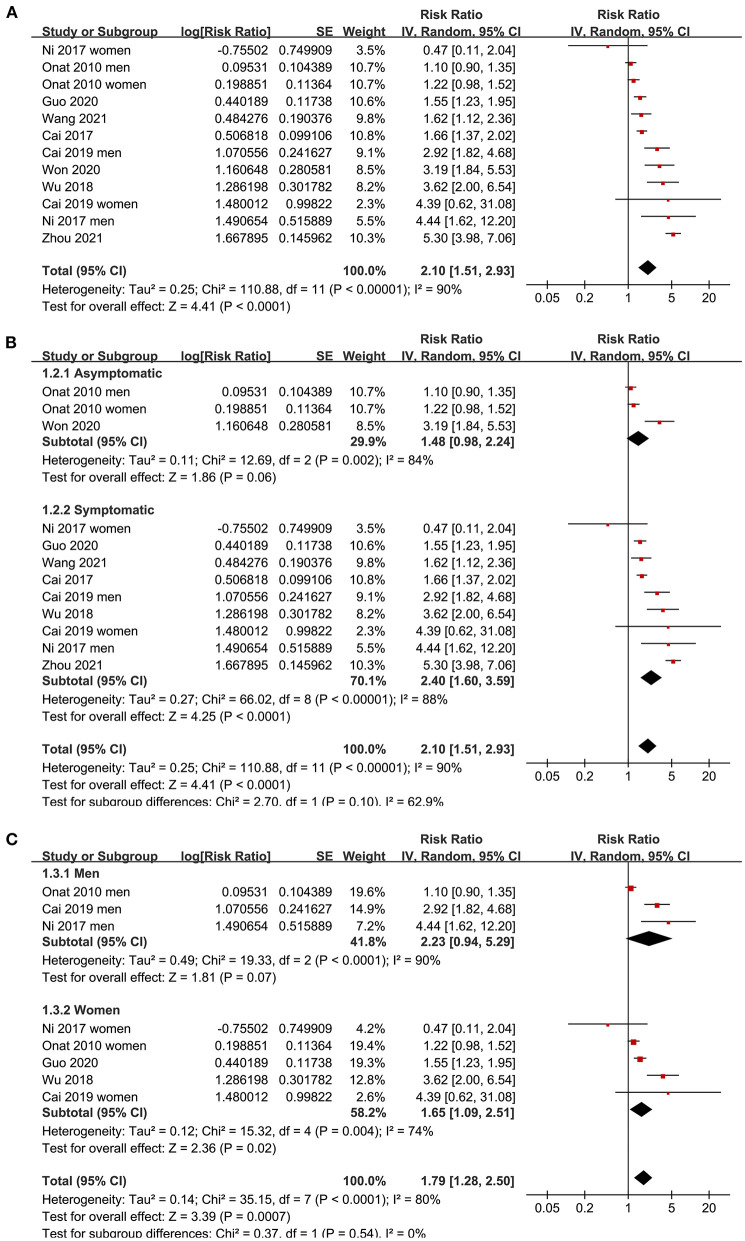
Figure 2.
Forest plots for the meta-analysis of the association between the AIP analyzed as a continuous variable and the odds of CAD in the adult population. (A) Overall meta-analysis; (B) Subgroup analysis according to the health status of the participants; and (C) Subgroup analysis according to the sex of the participants.

