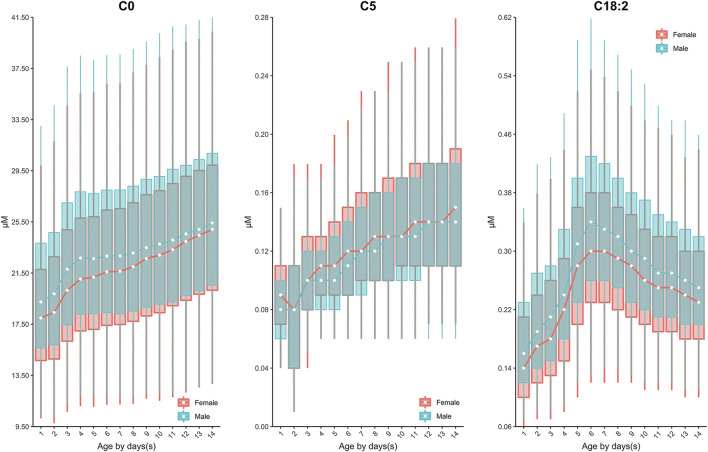
FIGURE 4.
The dynamic change of C0, C5, C18:2 over age and sex. The data of male and female partitions are shown in green and red boxes with whiskers, respectively. The boxes extend from the 25th to the 75th percentile, with whiskers extending to the 2.5th or 97.5th percentile. The medians are shown as white circles in the body of the boxes, and are linked with green (male) or red (female) line to shown the dynamic trends over age. Abbreviations are listed in the legend of Table 2.

