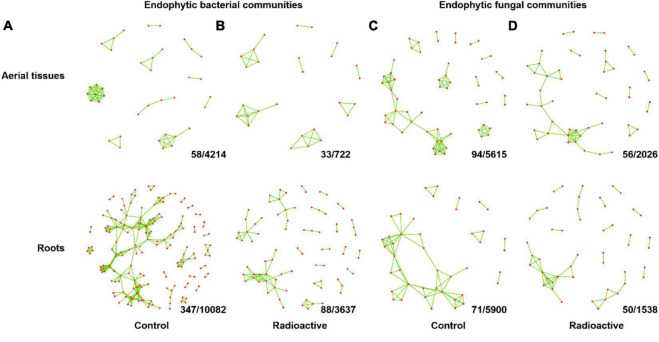
FIGURE 7.
Combined network showing co-occurrence relationships among endophyte communities in two or more seasons. The inter taxa co-occurrences of endophytic bacterial communities in each season at the control site (A) or radiation stressed site (B) were counted, and co-occurrences relationships presented in only one season were removed. Combined network of endophytic fungal communities at the control site (C) and radiation stressed site (D) were generated using the same method. Values at the bottom right of each grid indicate the number of co-occurrence relationships presented in no less than two seasons/numbers of co-occurrence relationships presented in at least one season. See Supplementary Table 4 (bacteria) and Supplementary Table 5 (fungi) for counterparts of each co-occurrence relationship in the network graph.

