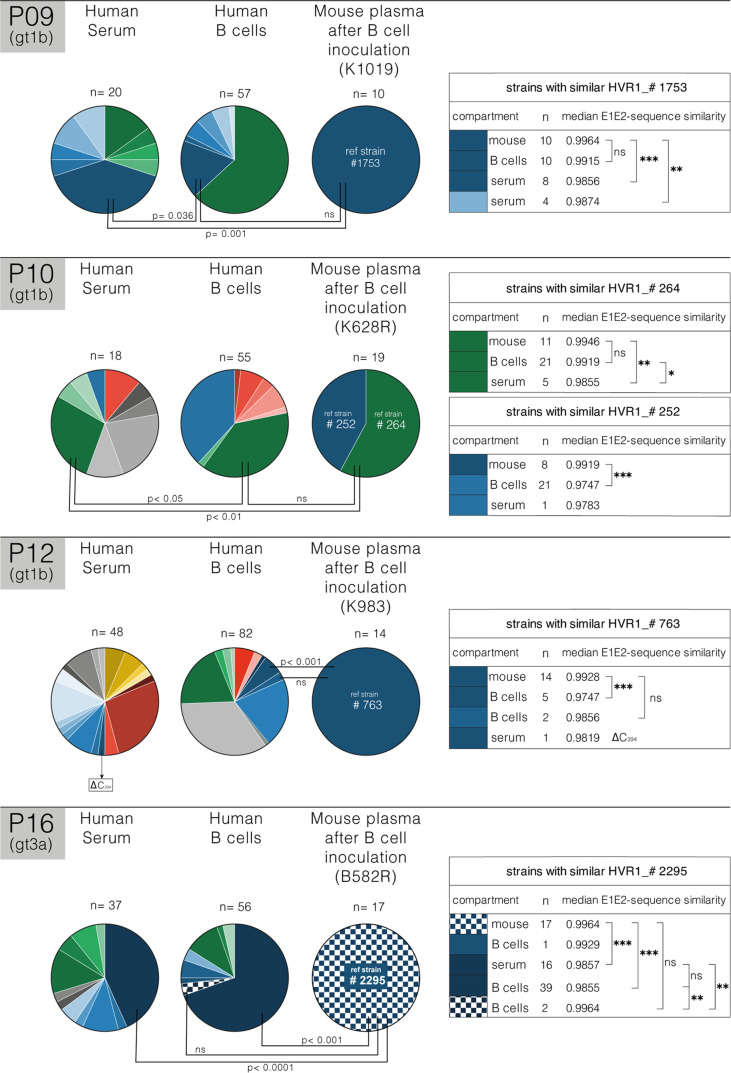
Figure 3.
Quasispecies analysis of B cell mediated infection. Schematic representation of HVR1 viral quasispecies (QS) distribution in human serum and B cells at the time of injection and in uPA-SCID plasma for three gt1b-patients (P09, P10 and P12) and one gt3a-patient (P16). Pie charts represent the fraction of each clone per compartment based on HVR1-diversity (number of clones analyzed, and mouse identification are shown). HVR1-isolates are unique for each patient and indicated by different colors. Closely related HVR1-variants, based on individual AA-similarity and clustering in phylogenetic analysis, are depicted in different intensities of the same color ( Supplementary Figure 4 ). For each patient a representative mouse strain (#1753,…) is depicted and pairwise full E1E2 similarity to similar strains in other compartments was calculated using the IDENTIFY similarity matrix for pairwise alignment (Bioedit Sequence Alignment Editor, right panel). For each compartment, the number (n) of similar clones and their median E1E2-sequence similarity with mouse-derived strains are shown in the tables on the right. Differences between pairwise E1E2-sequence similarities were calculated (*p<0.05; **p<0.01; ***p<0.001; ns, non-significant; Mann-Whitney U test) and shown on the pie charts. In the serum of P12, the only strain that showed similarities to the reference mouse strain carried a C-deletion at position AA394 (Δ C394), suggesting non-viability. For P16, variability in two additional E2-regions was considered and depicted by shading. Analysis demonstrates that mouse-derived strains occurring after B cell transfer closely resemble strains found in the B cell compartment (p=ns), and are significantly different from serum-derived strains.

