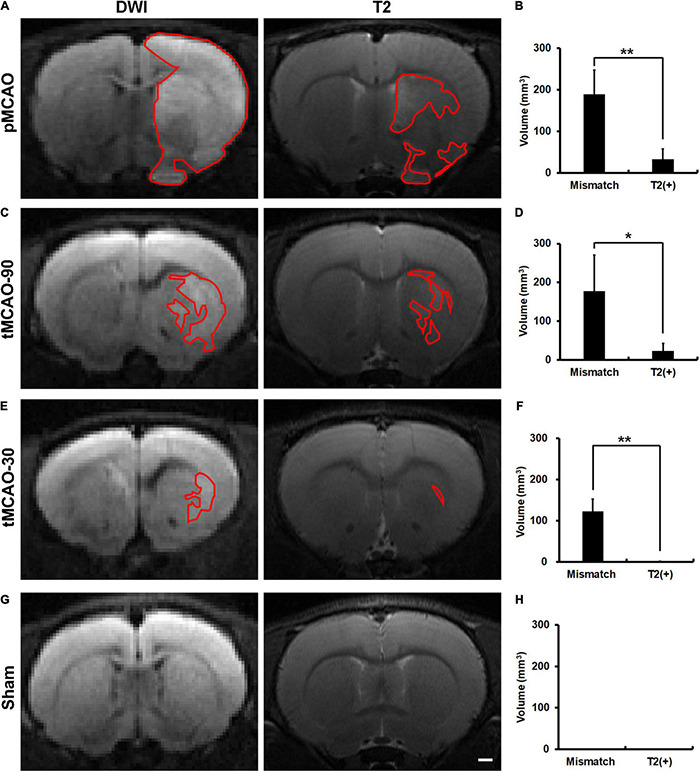
FIGURE 1.

Brain MR images of rats, within 4.5 h after permanent middle cerebral artery occlusion (pMCAO), transient middle cerebral artery occlusion (tMCAO), or sham operation. (A,C,E,G) Representative images of DWI and T2 at the corresponding sections of rat brains after pMCAO (A), tMCAO 90 min (tMCAO-90, C), tMCAO 30 min (tMCAO-30, E), and sham operation (G). The areas outlined by red lines indicates the regions with hyperintensity. The hyperintense areas on both T2 and DWI were defined as T2(+) regions, while those with hyperintensity on DWI but not on T2 were the mismatch areas. (B,D,F,H) These graphs show the comparison of the volumes of mismatch and T2(+) regions among the pMCAO (B, n = 8), tMCAO-90 (D, n = 5), tMCAO-30 (F, n = 4), and sham (H, n = 4) groups. The volumes of the mismatch areas were significantly larger than those of the T2(+) areas in the three ischemic conditions (*p < 0.05; **p < 0.01). The T2(+) volumes in the tMCAO-30 group were significantly smaller than those in the pMCAO (p = 0.007) and tMCAO-90 groups (p = 0.014), while the T2(+) volumes were similar between the tMCAO-90 and pMCAO groups. (G,H) Sham-operated animals (n = 4) did not have hyperintensity lesions on DWI and T2 weighted images. Scale bar = 10 μm.
