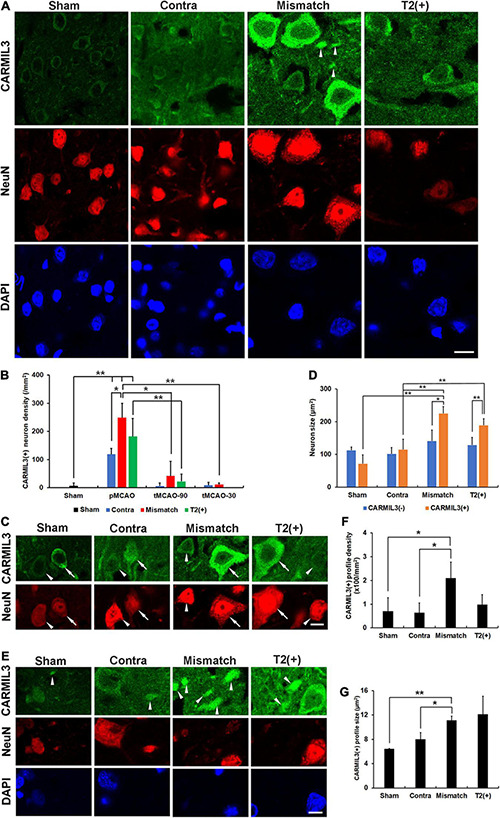
FIGURE 3.

CARMIL3 expression pattern. (A) Expression of CARMIL3 and NeuN in the T2(+), mismatch, contralateral regions of pMCAO groups and sham group. In addition to being expressed in neuronal cytoplasm, CARMIL3 was also expressed in some cell parts without direct connection with neuronal bodies, named CARMIL3(+) profiles (arrowhead). (B) CARMIL3(+) neuron densities at different ischemic cortical regions in pMCAO and tMCAO of rat brains. The expression of CARMIL3 in the T2(+) region after tMCAO-30 was not quantified due to nearly lack of cortical T2(+) area. There was a significant difference in CARMIL3(+) neuron densities among the three regions after pMCAO (p = 0.028), and all of them were significantly higher than that in the sham group (all p < 0.01). CARMIL3(+) neuron densities in the mismatch regions after pMCAO were higher than those in the contralateral areas (p = 0.026) and mismatch regions after tMCAO-90 (p = 0.044) or tMCAO-30 (p = 0.002). The CARMIL3(+) neuron densities at mismatch regions were significantly different across the three different ischemic durations (p < 0.0001). The CARMIL3(+) neuron densities at the T2(+) regions after tMCAO-90 were significantly reduced than those after pMCAO (p = 0.003). (C,D) Representative images of CARMIL3(+) (arrows) and CARMIL3(−) neurons (arrowheads) at the three regions in pMCAO brains, showing that CARMIL3(+) neurons were bigger than CARMIL3(−) neurons in the T2(+) and mismatch regions. Moreover, CARMIL3(+) neurons at the T2(+) or mismatch regions were significantly bigger than those in contralateral areas. Two-way ANOVA analysis showed regions (p = 0.017) and CARMIL3 positivity (p = 0.018) significantly affected neuron sizes. (E) Representative images of CARMIL3(+) profiles which were more prominent in the mismatch regions. (F,G) The CARMIL3(+) profiles in the mismatch regions were more abundant (F) and larger (G) than those in the contralateral regions or sham group (all p < 0.05). Contra, contralateral. Scale bars = 10 μm. N = 4 rats in each group. *p < 0.05; **p < 0.01.
