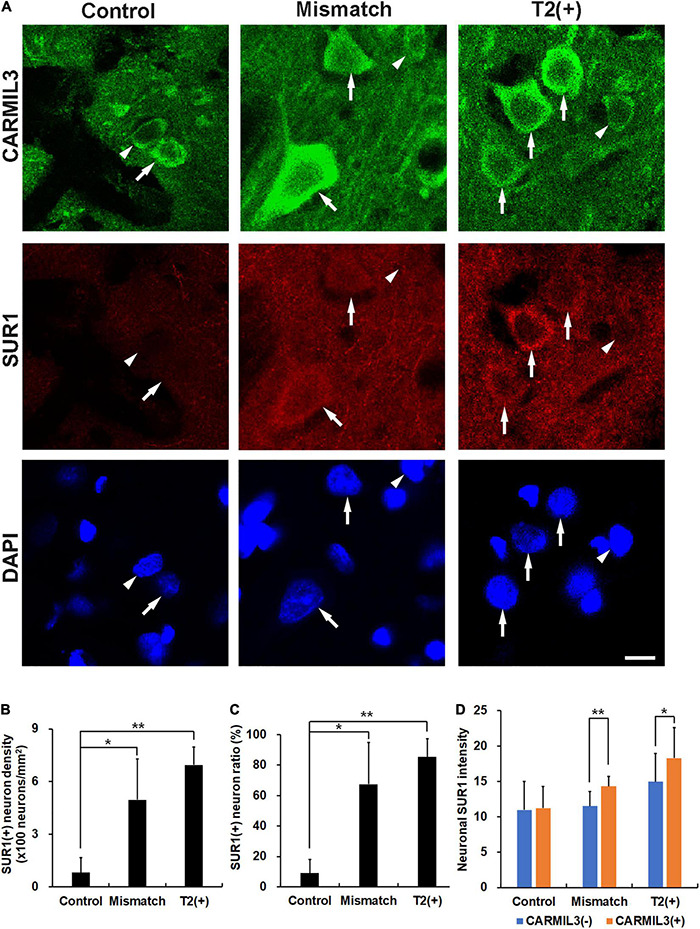
FIGURE 6.

Expression of sulfonylurea receptor 1 (SUR1) in CARMIL3(+) neurons. (A) CARMIL3(+) neurons (arrows) had higher SUR1 intensity than CARMIL3(−) ones (arrowheads) in the mismatch and T2(+) regions after pMCAO. On the contrary, there was a low expression of SUR1 in the neurons at the control regions. (B,C) SUR1(+) neuron densities were significantly different among the three regions (p = 0.009), and so were SUR1(+) neuron ratios [the number of SUR1(+) neurons divided by that of all neurons] (p = 0.015). Higher SUR1(+) neuron densities (B) and neuron ratios (C) were noted in the mismatch and T2(+) regions compared with the control areas (all p < 0.05). (D) CARMIL3(+) neurons had significantly higher SUR1 intensity than CARMIL3(−) neurons in the mismatch and T2(+) regions. *p < 0.05; **p < 0.01. N = 4 rats in each group. Scale bar = 10 μm.
