Figure 4.
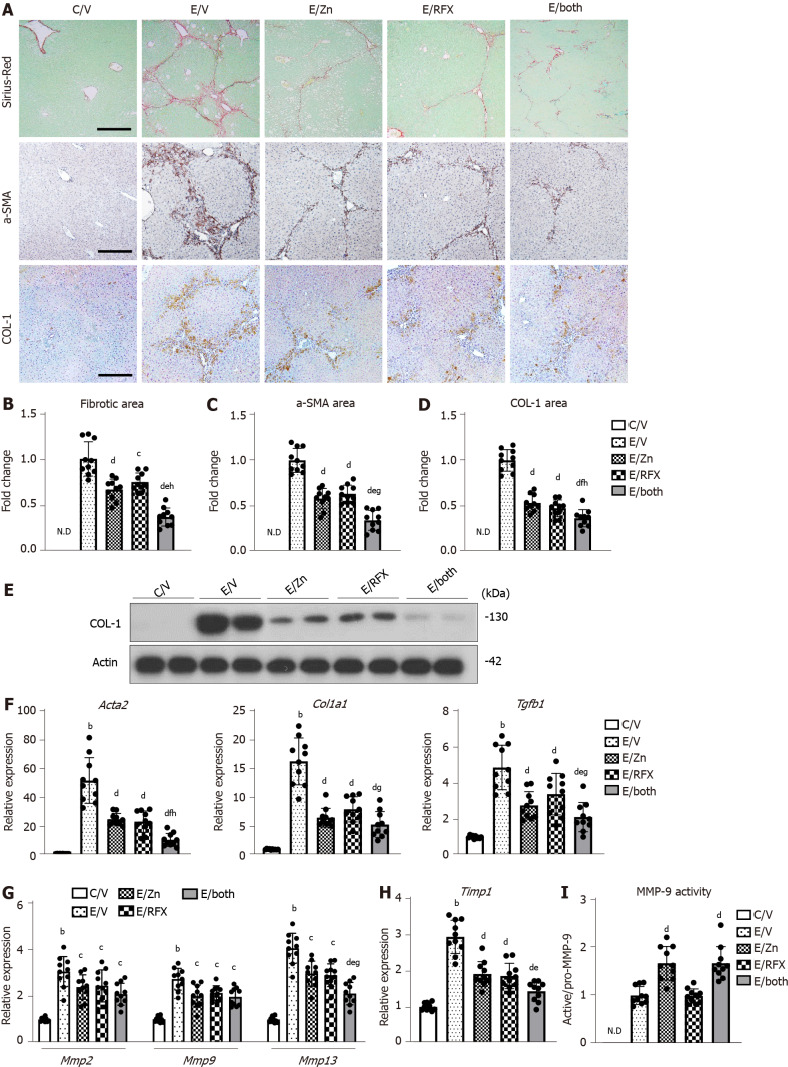
Zinc acetate and rifaximin against liver fibrosis development in alcoholic liver disease mice. A: Representative microphotographs of liver sections stained with Sirius-Red, α-smooth muscle actin (αSMA) and COL-1. Scale bar: 50 μm; B-D: Semi-quantitation of Sirius-Red-stained fibrotic area (B), α-SMA (C) and COL-1 (D) immuno-positive areas in high-power field (HPF) by NIH imageJ software. Histochemical quantitative analyses included five fields per section; E: Western blots for COL-1 in the liver of experimental mice. Actin was used as internal control; F-H: Relative mRNA expression levels of Acta2, Col1a1 and Tgfb1 (F), Mmp-2, -9 and -13 (G), and Timp1 (H) in the liver of experimental mice. The mRNA expression levels were measured by RT-qPCR, and Gapdh was used as internal control; I: Intrahepatic MMP-9 activity determined by ELISA. Quantitative values are indicated as fold changes to the values of E/V (B-D and I) or C/V group (F-H). Data are mean ± SD (n = 10), aP < 0.05 and bP < 0.01 vs C/V group; cP < 0.05 and dP < 0.01 vs E/V group; eP < 0.05 and fP < 0.01 vs E/Zn group; g P < 0.05 and h P < 0.01 vs E/RFX group. ND: Not detected; αSMA: α-smooth muscle actin.

