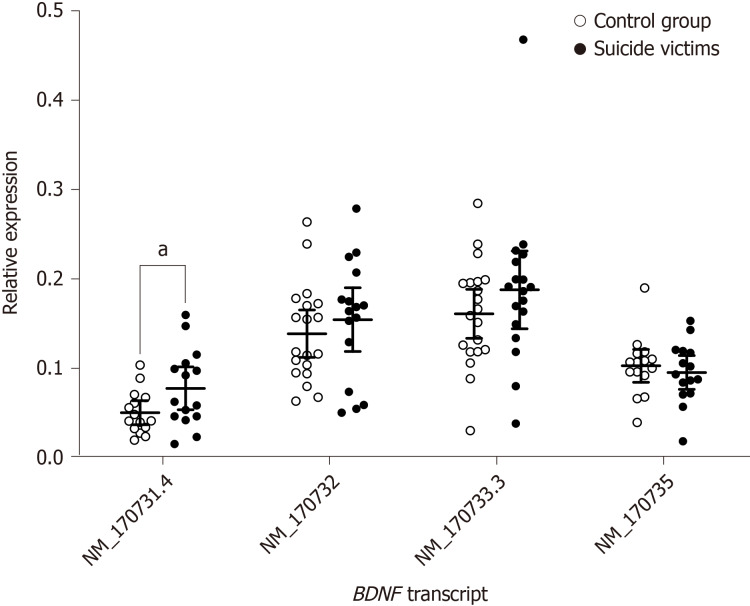
Figure 3.
Relative expression levels of alternative BDNF transcripts in the Brodmann area 9 brain region of the control subjects and suicide victims. Each circle symbol represents an individual study subject. Data are medians (horizontal bars) of the mean methylation levels for the BDNF regions ± 95% confidence interval (black, suicide victims). aP < 0.05 (two-tailed Student’s t test for two independent samples) between groups.

