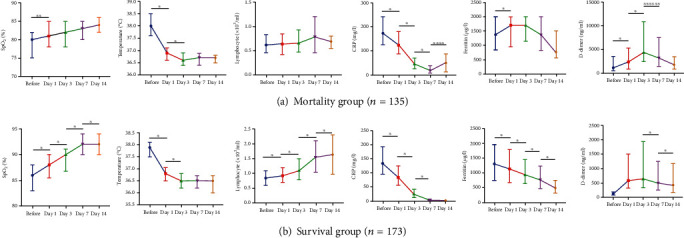
Figure 1.

Comparison of the (a) SpO2, (b) temperature, (c) lymphocytes, (d) CRP, (e) ferritin, and (f) d-dimer parameters in the mortality group (a) and survival group (b) at different time points after tocilizumab administration. Data are presented with median and IQR (the 25th and 75th percentiles). ∗p < 0.001, ∗∗p = 0.005, ∗∗∗p = 0.009, ∗∗∗∗p = 0.001, ∗∗∗∗∗p = 0.003, and ∗∗∗∗∗∗p = 0.048.
