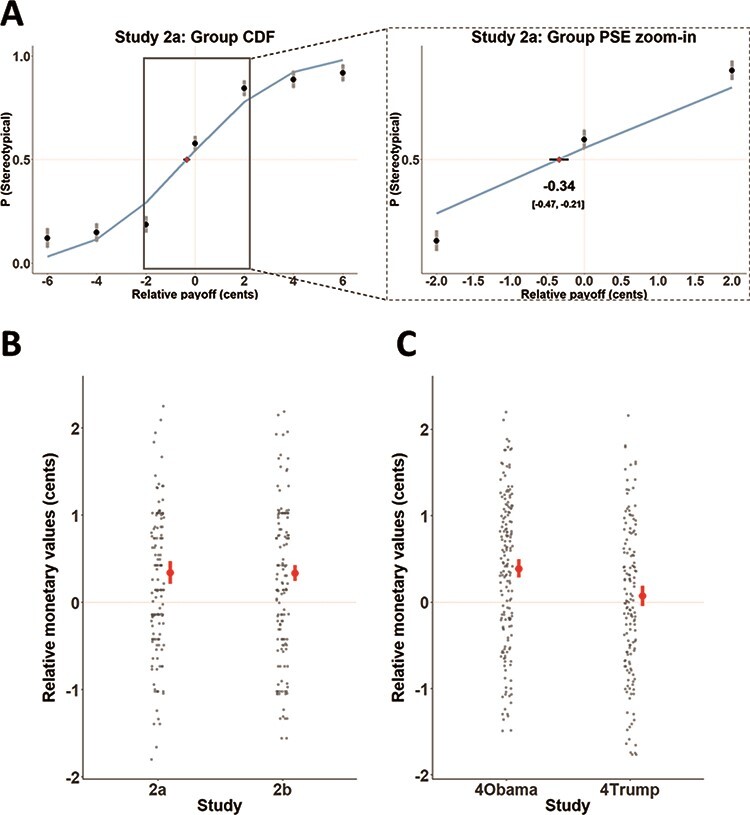
Fig. 3.

The monetary values of consistency with stereotype and person-specific expectations. (A) Visualization of the cumulative distribution function we used to calculate the PSE, illustrated by group data from Study 2a. The x-axis represents the difference between the monetary values associated with the two target types presented in each trial. Each dot indicates the proportion of trials in which participants chose to rate a stereotype-confirming over a stereotype-violating target. The PSE was calculated as the point at which a cumulative normal distribution function, fit to these responses, passes 50%. This point represents the relative monetary value associated with one target type over the other. Negative values indicate that participants preferred to incur a relative monetary loss to rate a confirming target. Error bars depict 95% CIs. (B) Distribution of individual PSE values for Study 2. Rating stereotype-consistent targets in Studies 2a and 2b was associated with significantly higher subjective value than rating stereotype-violating targets. Each gray dot depicts PSE for a specific participant. Red dots indicate the sample mean. Error bars depict 95% CIs. (C) Distribution of individual PSE values for Study 4. Rating Obama-consistent trials was associated with significantly higher subjective value than rating Obama-violating trials. However, rating Trump-consistent trials did not significantly differ from rating Trump-violating trials.
