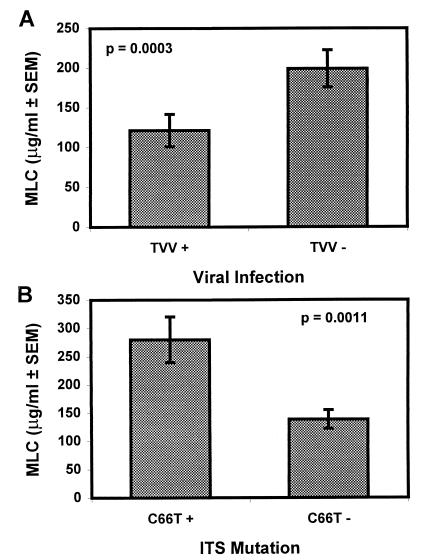
FIG. 3.
Average MLC for isolates with different characteristics. (A) The average MLCs of isolates grouped based on the presence or absence of TVV. (B) The average MLCs of isolates grouped based on the presence or absence of the rDNA ITS C66T mutation. Isolates with MLC values of >400 μg/ml were treated as 400 μg/ml.

