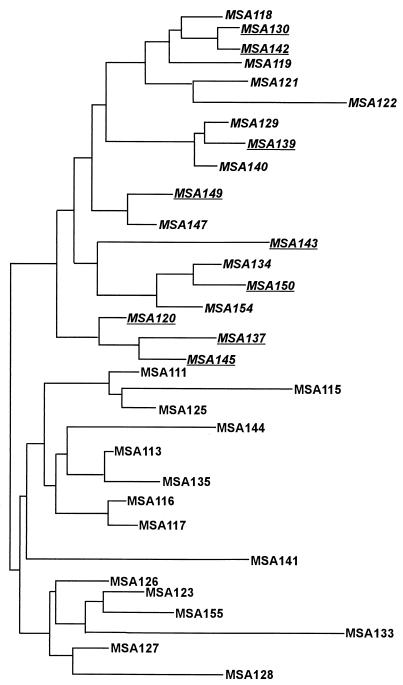
FIG. 4.
Dendrogram for MSA isolates based on RAPD data. The tree was built by the neighbor-joining method. The distance matrix was calculated with Pearson's phi coefficient based on RAPD data from three primers (29 bands). Isolates negative for TVV (italicized) all aggregated in the same (upper) branch, and TVV-positive isolates grouped together in a separate branch. All isolates with the rDNA ITS C66T mutation (underlined) also sorted into the main upper branch. Branch lengths are drawn to scale based on genetic distances between isolates.

