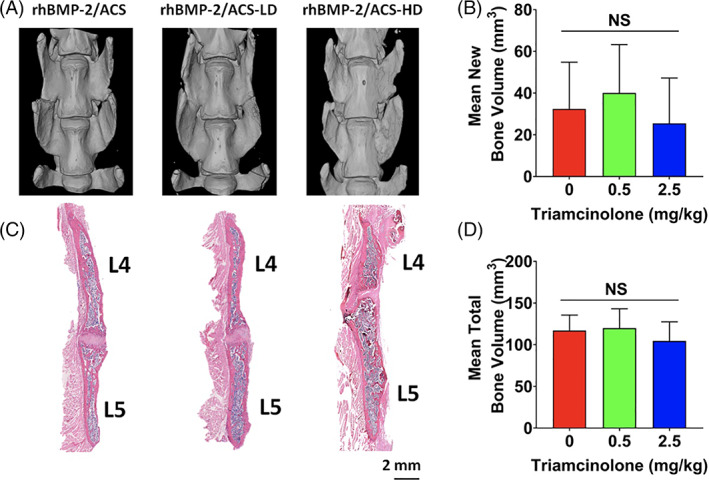
FIGURE 4.

Representative micro‐CT 3D rendering of specimens per each experimental group (A) and hematoxylin and eosin staining of representative spines (B) for each treatment group: rhBMP‐2/ACS, rhBMP‐2/ACS‐LD and rhBMP‐2/ACS‐HD (LD = low‐dose triamcinolone, 0.5 mg/kg; HD = high‐dose triamcinolone, 2.5 mg/kg). New bone volume (C) and total bone volume (D) as quantified by micro‐CT scan for each treatment group. Values are reported as mean ± SD (n = 6, per each group). The threshold for statistical significance was P < .05 (NS = not significant)
