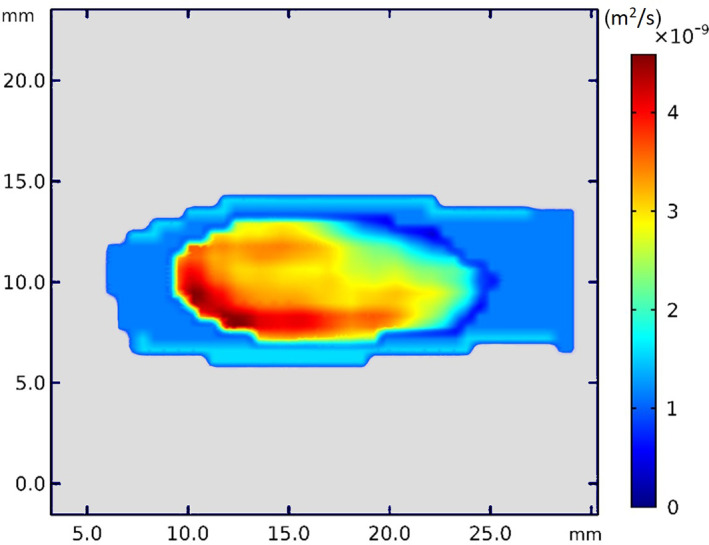
FIGURE 4.

Glucose diffusion map of intervertebral disc #1, disc level L3L4. Incorporating apparent diffusion coefficient (ADC) maps to calculate diffusion in the nucleus pulposus reflected the local variation in diffusion coefficients. No gradient could be observed in the cartilaginous endplates and annulus fibrosus because ADC maps were not obtained at a resolution high enough to allow for extraction of diffusion coefficients
