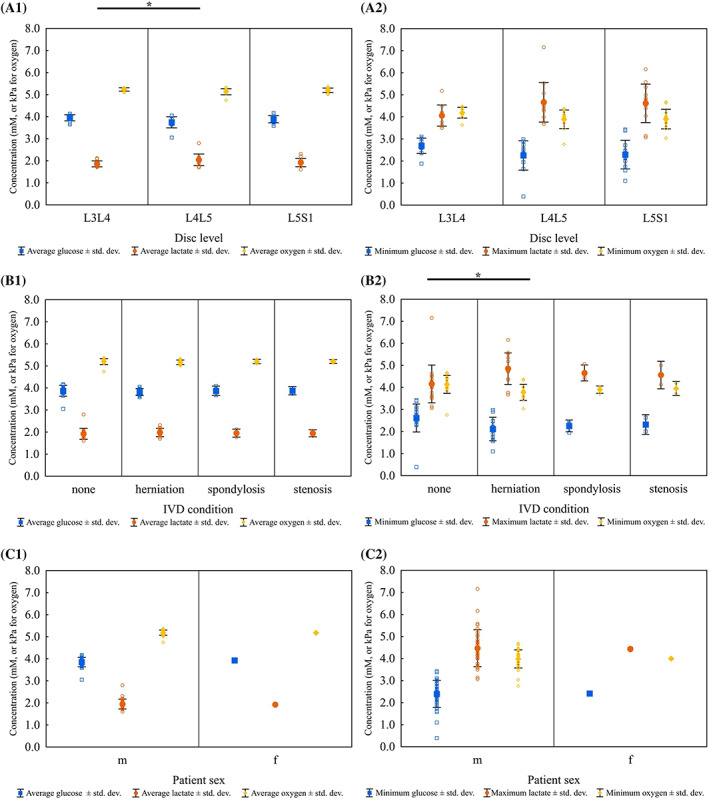
FIGURE 6.

Estimation of solute concentration means for glucose (mM), oxygen (kPa), and lactate (mM) in the IVD vs patient characteristics. (A1, A2) disc level, (B1, B2) IVD pathology condition, and (C1, C2) patient sex. An * indicated significance with a P‐value of .05
