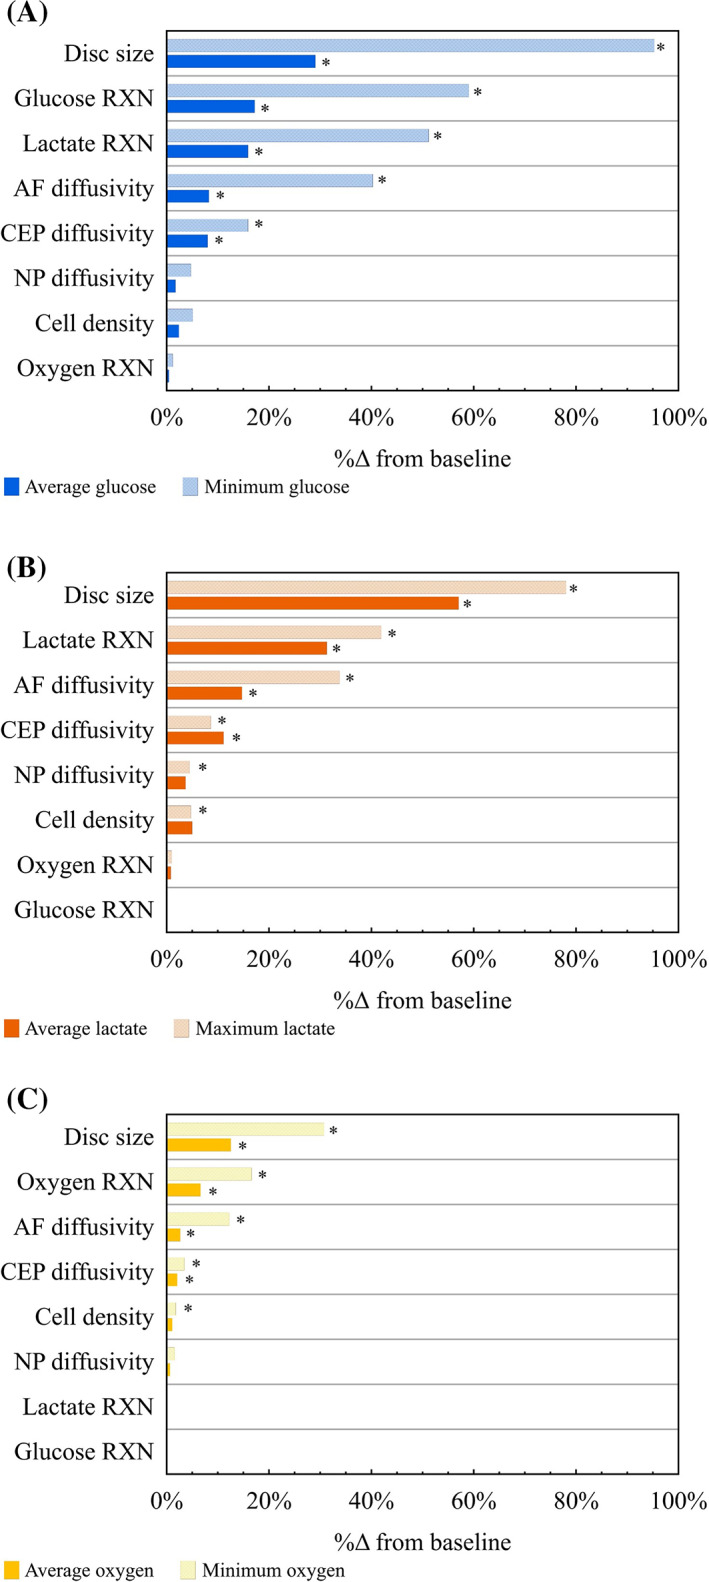
FIGURE 8.

Sensitivity analysis on model variables including, diffusivity of the annulus fibrosus, cartilaginous endplates, and nucleus pulposus, reaction rates (RXN) of glucose, lactate, and oxygen, cell density, and disc size. Solute % change from baseline values are presented for (A) glucose, (B) lactate, and (C) oxygen. General linear model was performed to find significance indicated by * (P = .05)
