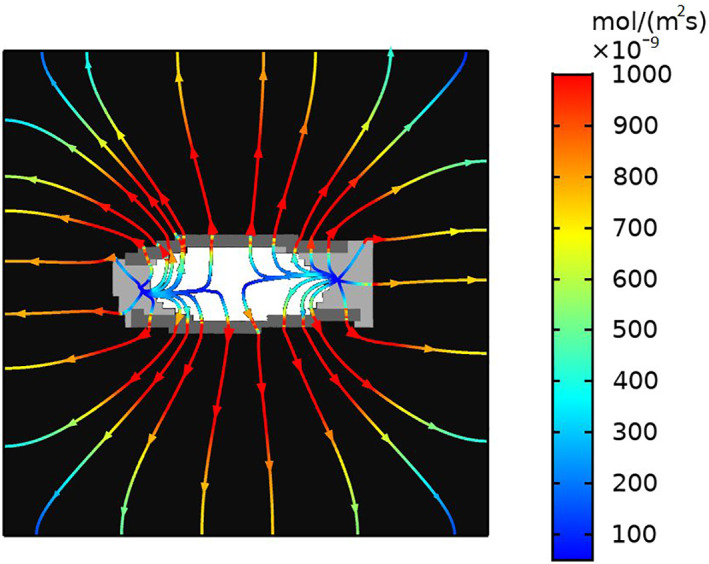
FIGURE 9.

Streamlines show lactate flux through the different parts of the IVD (annulus fibrosus [AF]: light gray, cartilaginous endplates [CEP]: dark gray, nucleus pulposus [NP]: white). The color scale reflects flux magnitude of lactate. High flux was observed near both CEPs, while the AF experienced low flux indicating better transport through the former. Long diffusion pathways extending from the inner AF through the CEP lead to low nutrient levels in the inner AF
