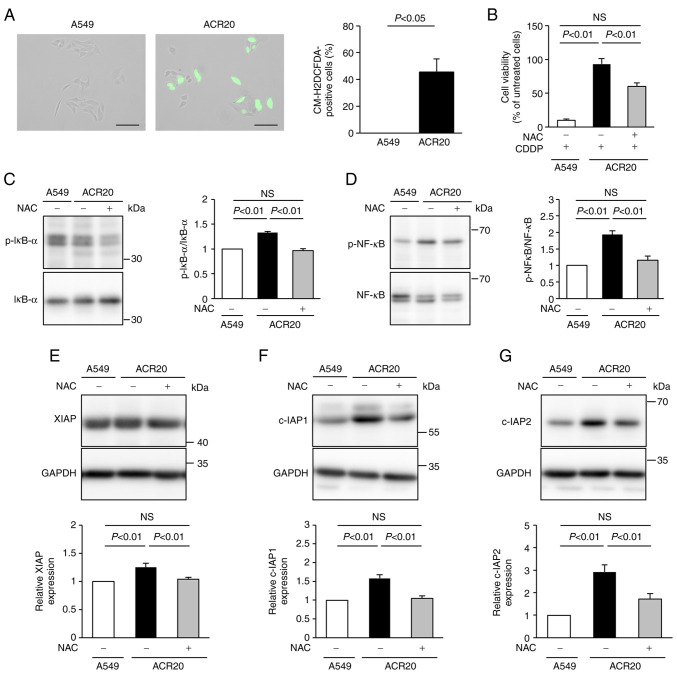
Figure 2.
Elevated levels of intrinsic ROS are involved in the mechanism of acquisition of CDDP resistance. (A) Cells were incubated with CM-H2DCFDA and observed by fluorescence microscopy. Representative images under the fluorescence microscope are shown on the left. The numbers of CM-H2DCFDA-stained cells were counted. On the right, bars represent mean ± SE (n=3). Scale bar, 100 µm. (B) Cells were treated with or without NAC for 24 h. Cells were washed with PBS and incubated with 80 µM CDDP for 72 h. Cell viability was measured using crystal violet assay. (C and D) Cells were treated with or without NAC for 24 h and then lysed. Phosphorylation levels of IκB-α and NF-κB were analyzed by western blotting, and p-IκB-α/IκB-α (C) and p-NF-κB/NF-κB (D) ratios were determined. Bars represent mean ± SE (n=3). (E-G) Expression levels of XIAP (E), c-IAP1 (F), and c-IAP2 (G) were analyzed by western blotting. Bars represent mean ± SE (n=3). ROS, reactive oxygen species; CDDP, cisplatin; NAC, N-acetyl-L-cysteine; IAP, inhibitors of apoptosis protein.

