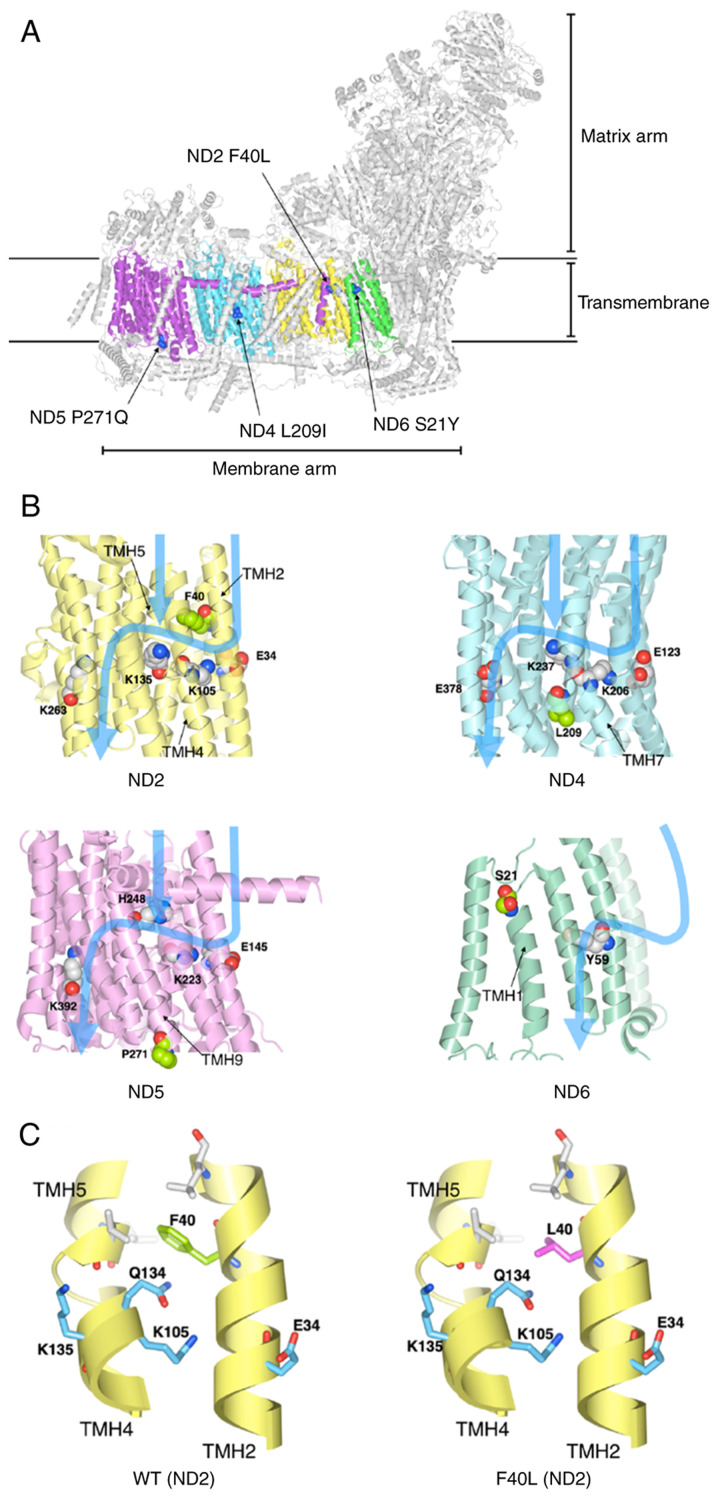
Figure 6.
Structural analysis of proteins with the identified mtDNA mutations. (A) Locations of mutations in the three-dimensional structure of mitochondrial complex I. ND2, ND4, ND5, and ND6 are depicted in yellow, cyan, purple and green, respectively. The mutated amino acid residues are shown in blue. (B) Blue arrows indicate the path of proton translocation. Space-filling model indicates the charged amino acid residues (key residues) that are thought to be involved in proton translocation. The amino acid residues of four identified mutations are depicted in light green. (C) The F40L mutation may alter ND2 protein structure. Phe40 (left) and Leu40 (right) are depicted in green and magenta, respectively. Important amino acids for proton translocation are depicted in light blue. mtDNA, mitochondrial DNA; ND, NADH-ubiquinone oxidoreductase chain.

