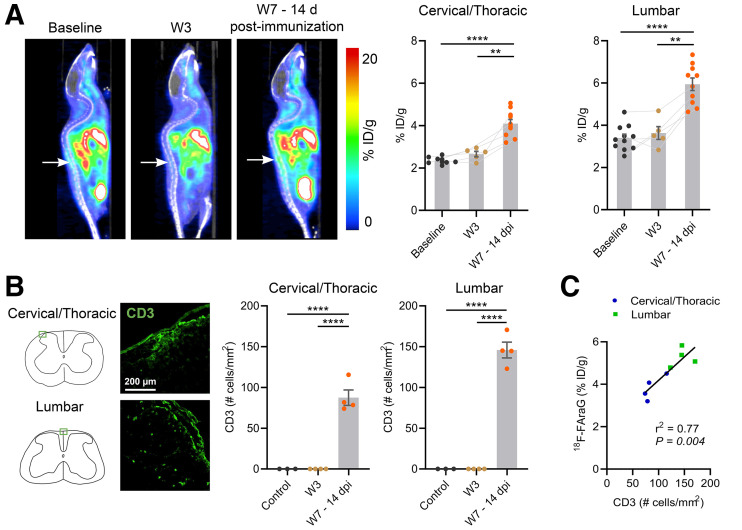
FIGURE 4.
(A) 18F-FAraG PET/CT sagittal images at baseline, W3, and W7–14dpi. Arrows point to lumbar spinal cord. Graphs show corresponding quantification of 18F-FAraG signal in cervical/thoracic and lumbar spinal cord. (B) Immunofluorescence images of CD3 T cells (green) in cervical/thoracic and lumbar spinal cord at W7–14dpi, and quantification of CD3 immunostaining at baseline, W3, and W7–14dpi. (C) Correlation of 18F-FAraG signal with CD3 T cells at W7–14dpi. ID = injected dose. **P ≤ 0.01. ****P ≤ 0.0001.

