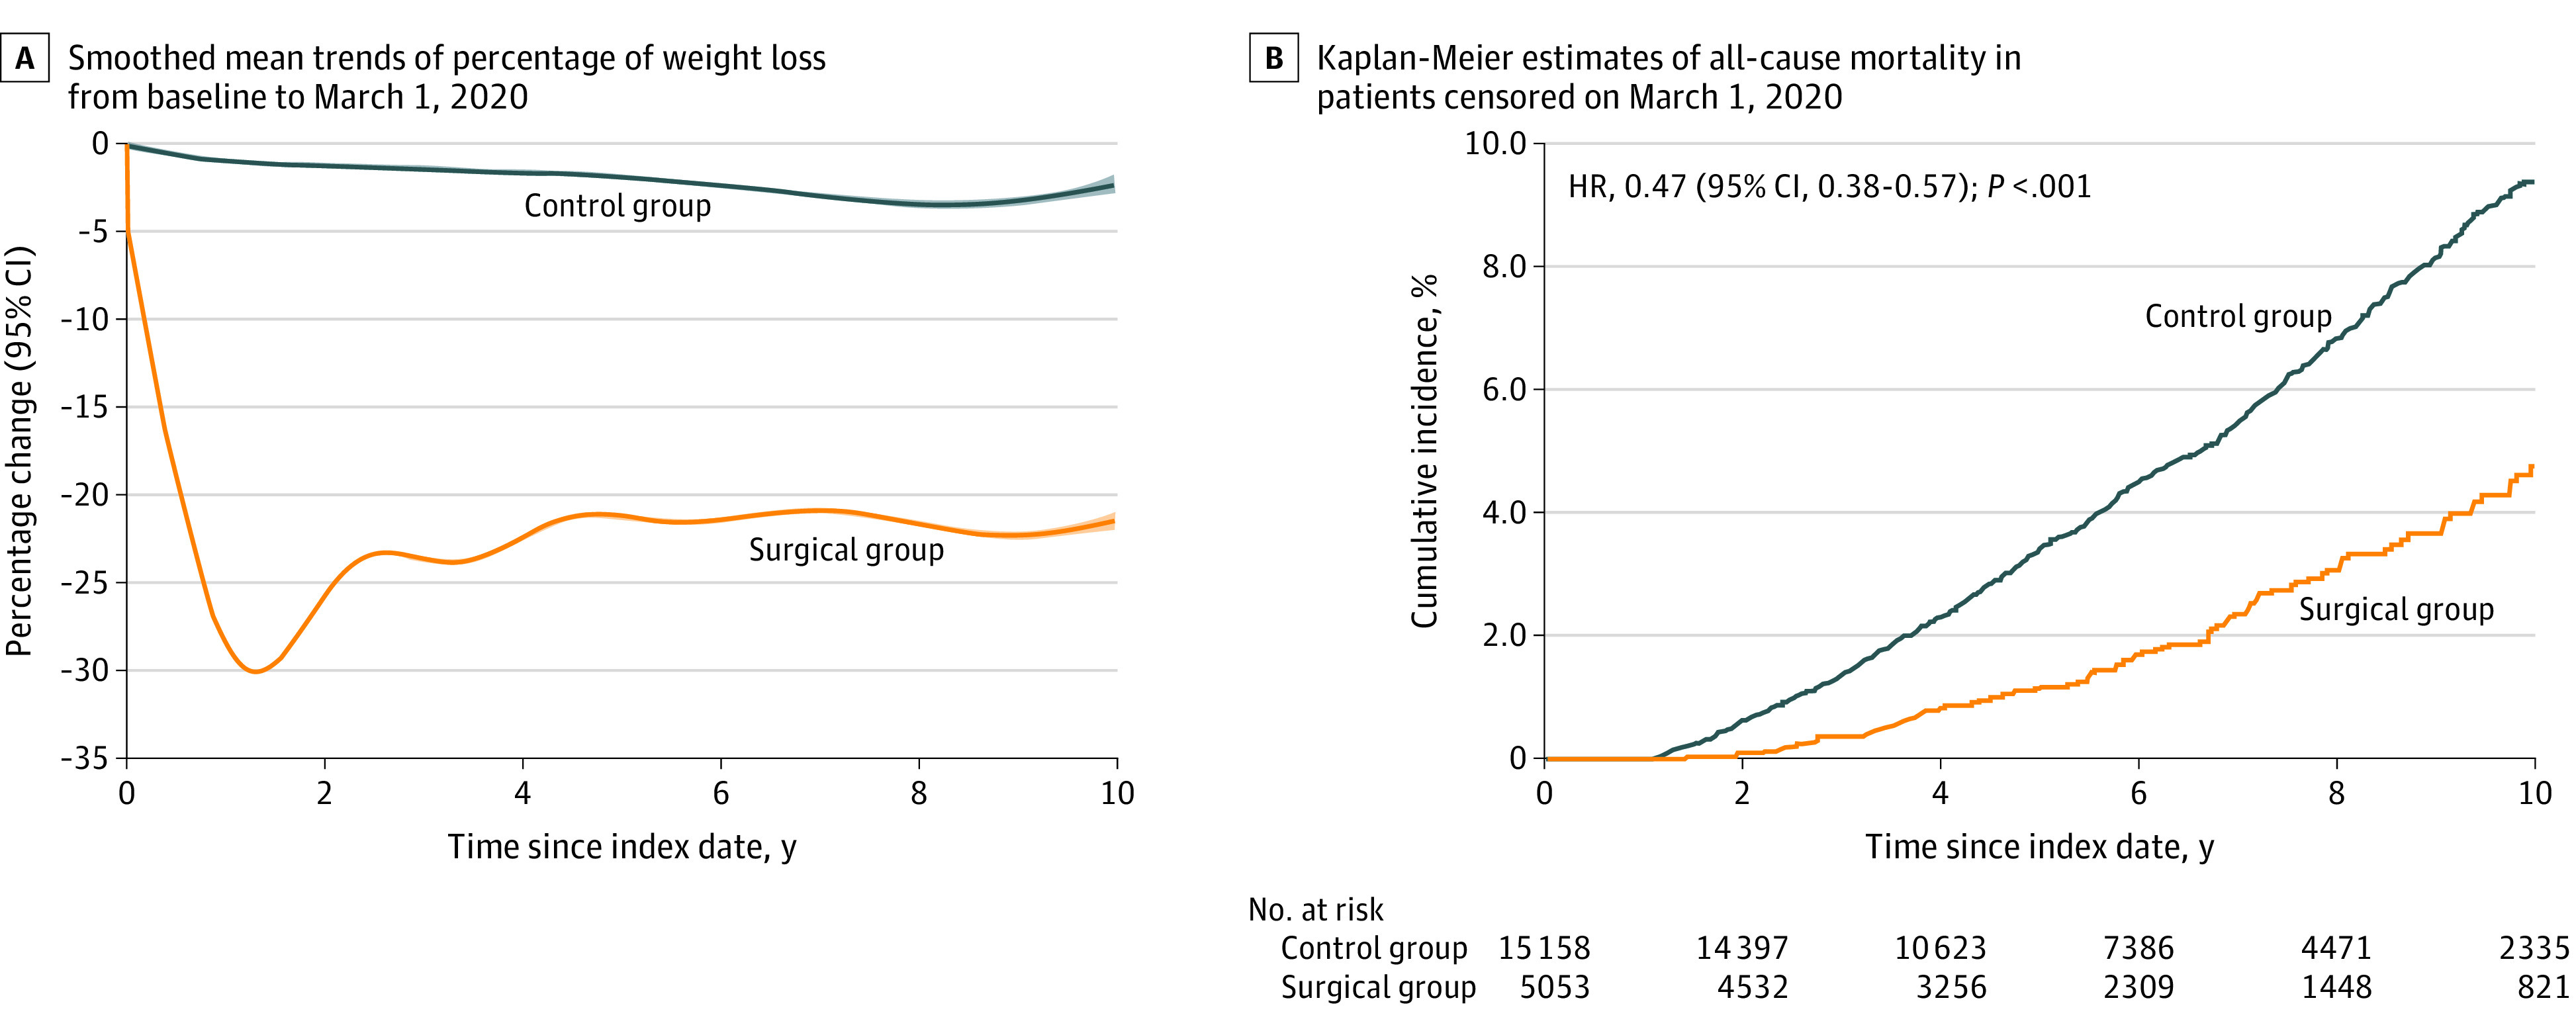
Figure 1. Weight Loss and Survival Data of Patients Over 10 Years of Follow-up Before the COVID-19 Outbreak.

A, The mean differences in total weight loss at 10 years (censored on March 1, 2020) between surgical and control groups were estimated from a flexible regression model with a 4-knot spline on time since the index date interacted with the treatment group. B, Hazard ratios (HRs) (95% CIs) and P values were from fully adjusted Cox proportional hazards regression model that compared the relative risk of all-cause mortality in surgical vs control group (censored on March 1, 2020). All baseline variables in Table 1 were included to adjust for potential confounding.
