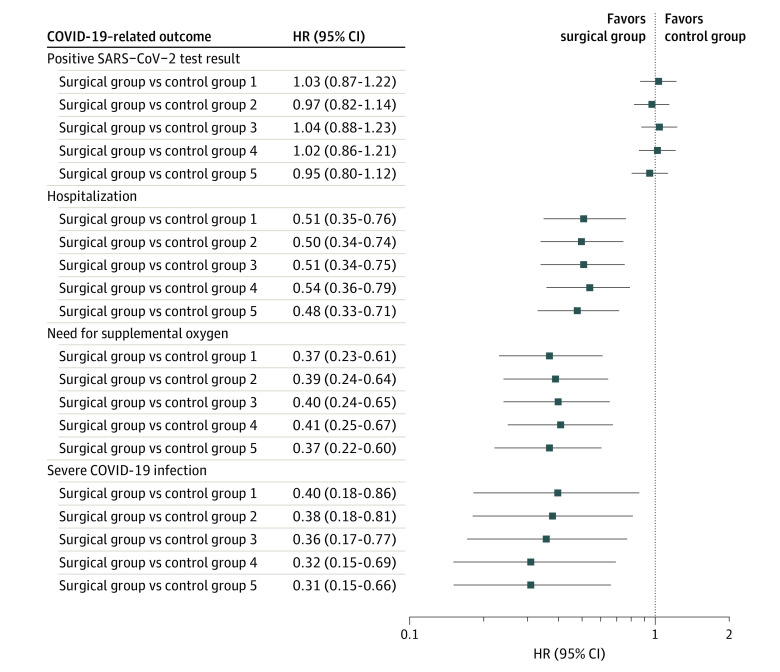
Figure 3. Sensitivity Analysis.
The surgical index dates were randomly assigned (5 times) to patients in the control group, and 5 data sets were created with the matching ratio of 1:3. The fully adjusted Cox proportional hazards regression models were run on each of the 4 COVID-19–related outcomes, and the hazard ratios (HRs) and 95% CIs for the treatment variable were obtained for each outcome in 5 data sets. Control group 1 represents the primary group who did not undergo surgery and whose data were reported in the article. The consistency of results in the sensitivity analysis supports the robustness of the findings.

