Abstract
Rationale:
We assessed the prognostic utility of 11C-Methionine positron emission tomography (MET-PET) in pediatric high-grade glioma (HGG).
Methods:
Thirty-one children had 62 MET-PET studies. Segmented tumor volumes from co-registered magnetic resonance studies were assessed for concordance with MET-PET uptake using Boolean operations. The tumor volume at diagnosis and treatment failure was assessed relative to MET-PET avid volume. The prognostic impact of MET-PET–delineated non-contrast enhancing tumor (NCET) was assessed. NCET was defined as the region of tumor which did not enhance but showed MET-PET avidity.
Results:
MET-PET concordance varied according to magnetic resonance sequence. METPET rarely added to the tumor volume in most cases. The volume of MET-PET with standardized uptake value > 3.0 was differentially distributed at diagnosis, post treatment, and at recurrence. The initial MET-PET region overlapped with recurrent tumor in 90% of the cases. When the proportion of tumor which was NCET was > 10%, an earlier time to progression (5.8 months; 95% CI, 1–8.2 vs. 10.5 months; 95% CI, 0.9-NR; p=0.035) was noted.
Conclusion:
MET-PET delineates regions at increased risk for recurrence and may improve the definition of failure, prognostic assessment, and target definition for radiotherapy.
Keywords: MET-PET, Pediatric, High-grade Glioma
Introduction
Neuroimaging with positron emission tomography (PET) - characterization of glucose metabolism has had limited impact in the management of pediatric patients with high-grade gliomas (HGG). Both gliomas, gray-matter structures, and to a lesser extent white matter structures accumulate 2-[18F] Fluoro-2-deoxy-D-glucose (FDG), limiting distinction between tumor boundaries and non-involved brain [1]. Amino acid tracers, such as 11C-Methionine or analogs, are useful methods to assess neoplastic tissue in the brain because of their reduced uptake in normal brain cortex relative to that of FDG-PET [1]. Conventional magnetic resonance imaging (MRI) techniques have a limited ability to differentiate the heterogeneous regions of gliomas in children because of the characteristic absence of contrast enhancement in many tumors [2]. Although regions of non–contrast enhancing tumor have been described as being more virulent in adult HGG [3], means of identifying these regions as well as occult tumor in pediatric HGG are needed [4].
PET with 11C-Methionine (MET-PET) allows for the noninvasive qualitative and semi-quantitative assessment of amino acid transport, which has been correlated to tumor grade, prognosis, and radiation response in adult HGGs [5, 6]. Furthermore, MET-PET has been described as a means for delineating regions at high risk of treatment failure, which are not apparent on conventional MRI sequences or FDG-PET [7–9], for subsequent re-resection or radiotherapy dose escalation.
Given the difficulty of defining regions at high risk for recurrence in pediatric HGG, MET-PET may offer a means of improving tumor delineation, estimating prognosis and reducing recurrence. The purpose of this study was to examine the relationship of MET-PET to conventional MRI features and prognosis in pediatric HGG.
Patients and Methods:
Patient population:
Thirty-one patients with HGG (anaplastic astrocytoma or glioblastoma multiforme) were evaluated on a prospective, IRB approved protocol, at St. Jude Children’s Research Hospital from September 2009 to August 2015. All patients with suspected neoplastic disease were considered eligible. Only lactating females were excluded from enrollment to avoid potential harm/radiation exposure to infants. All patients were consented for involvement. The median follow-up was 24 months (Supplementary Table 1). Pertinent information was obtained from the St. Jude Electronic Medical Record (EMR) and includes demographics, clinical features, surgical characteristics and dates, treatment protocol, and dates of treatment failure and patient death.
PET scans:
Thirty-one patients underwent 63 MET-PET scans; 62 scans were available for review. Serial MET-PET scans were available for 21 patients, with 54 total scans. The median number of MET-PET scans per patient was two (IQR: 1–2, Range: 1–5). Patients underwent MET-PET at various time points. Patients, either directly or through his/her caregiver/legally authorized representative, were instructed to fast for 4 or more hours prior to the MET-PET scan. 11C-Methionine was prepared using published methods [10] and was administered under an Investigational New Drug (IND) authorization. Each patient was intravenously injected with 20 millicuries/1.7 square meters of body surface (maximum 20 mCi, minimum 5 mCi). Approximately 5 minutes later, a non-diagnostic, low-dose computed tomography (CT) scan and a static PET emission scan of the brain were obtained for 15 minutes in 3D mode. Images were reconstructed using standard vendor supplied software and displayed in axial, sagittal, and coronal orientations as contiguous planes of brain tissue. Images were obtained using a GE Discovery LS PET CT scanner (prior to April 2011) or GE Discover 690 PET CT scanner.
Imaging Features and Processing:
Magnetic resonance images (MRIs) (acquired <1 week apart) were registered with each MET-PET scan. The volume of tumor was delineated on each specified MR sequence (T1+Gd, T2 Flair, ADC) and MET-PET scan (Fig. 1). If the tumor was resected, the cavity and any abnormalities of the surgical cavities rim noted on that imaging sequence were included in the respective volume. MET-avid regions were segmented using the validated PET-edge method in MIM software (MIM Software Inc., Cleveland, OH), with manual adjustment in regions approximating the midbrain/basal ganglia because of the inherent increased uptake in these regions [11].
Fig. 1.
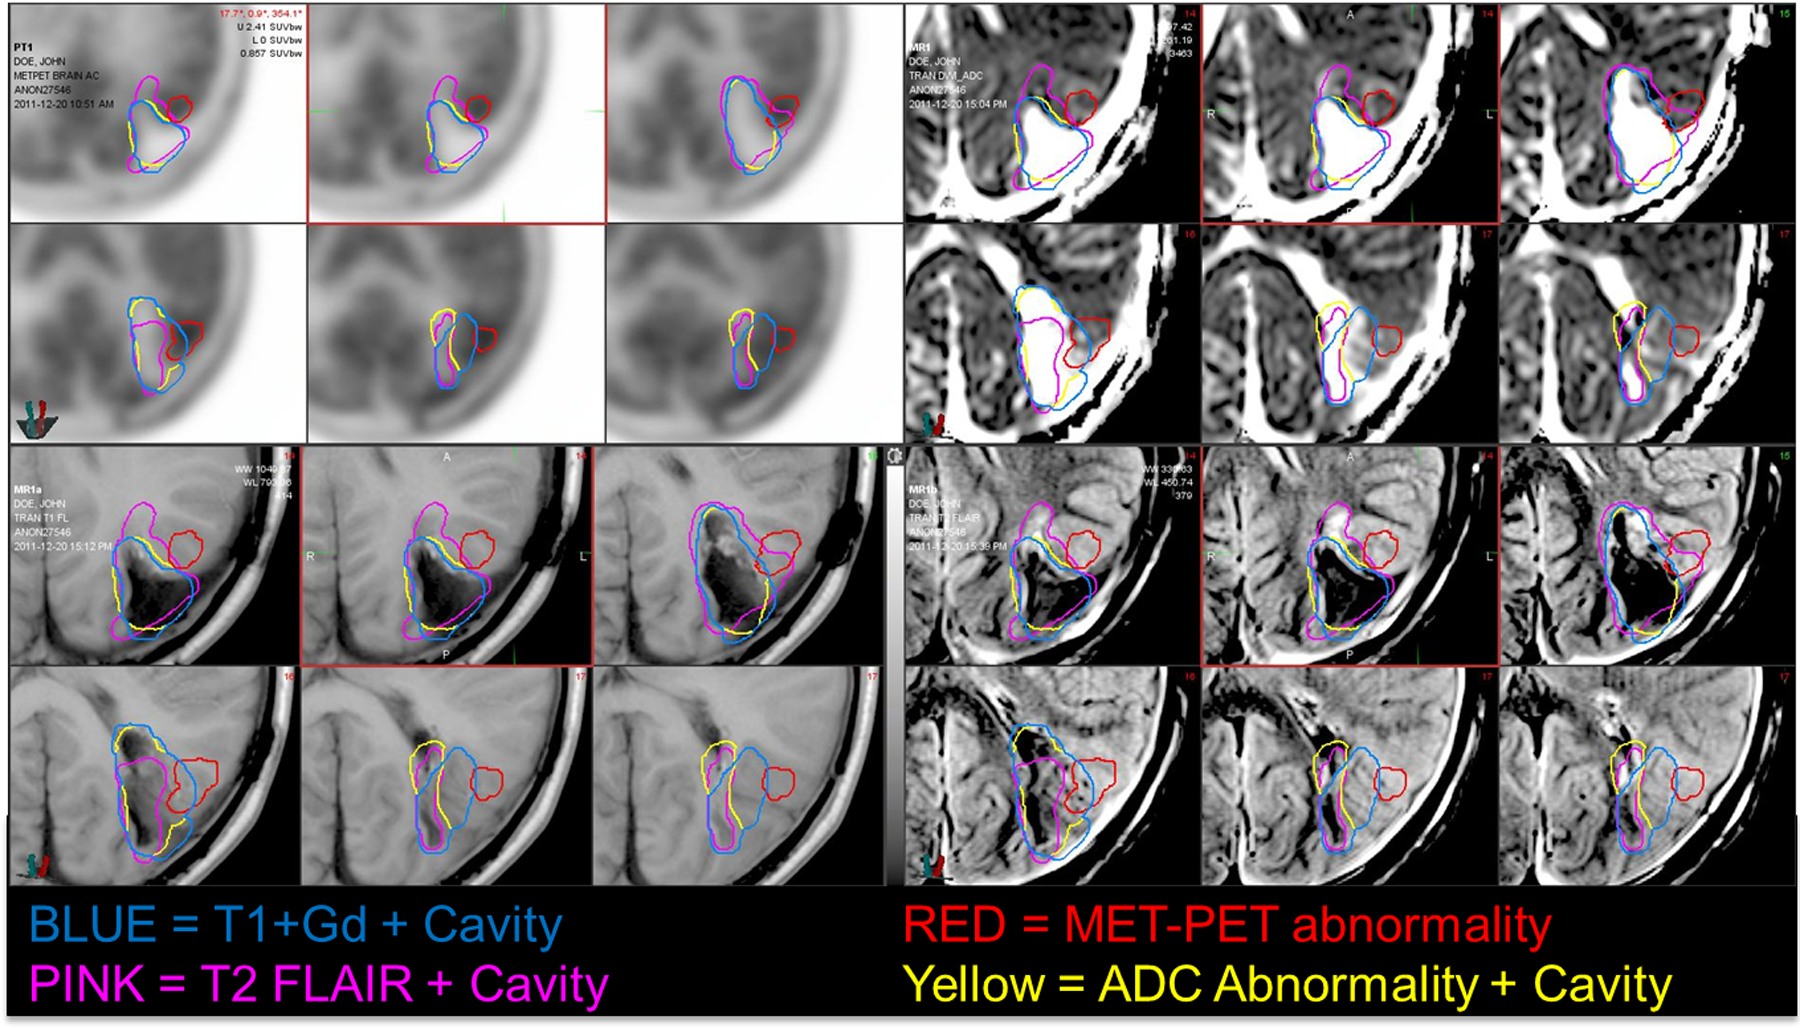
Panel Display of Segmented MR sequences and accompanying MET-PET scans. Segmented tumor/resection volumes are illustrated in purple (T2 Flair), yellow (T1+Gd), red (MET-PET), and blue (ADC). Top left, MET-PET; Top right, ADC map; Bottom left, T1+Gg; Bottom right, T2 Flair
Concordance between the volumes was assessed using Boolean operations in MIM. Concordance and discordance between volumes was defined as overlap/lack of overlap between the two segmented volumes of interest. Concordance and discordance between segmented volumes are sorted and illustrated using a waterfall plot in Figure 2. The volume and proportion of tumor representing tumor edema, tumor enhancement, and non–contrast-enhancing tumor was delineated; percentage and the quantitative volume in milliliters were assessed relative to the total quantifiable tumor volume. Non-contrast enhancing tumor (NCET) was defined as the region of T2 Flair–delineated tumor volume that was not coincident with the T1+Gd abnormality and was MET-PET–positive. The proportion of NCET (pNCET) was derived by calculating the ratio of NCET to total tumor volume delineated by T2 Flair. The volume and percentage of total tumor across successive standardized uptake value (SUV) intervals from 1–10 in 0.5 increments were calculated and compared across time points and events.
Fig. 2.
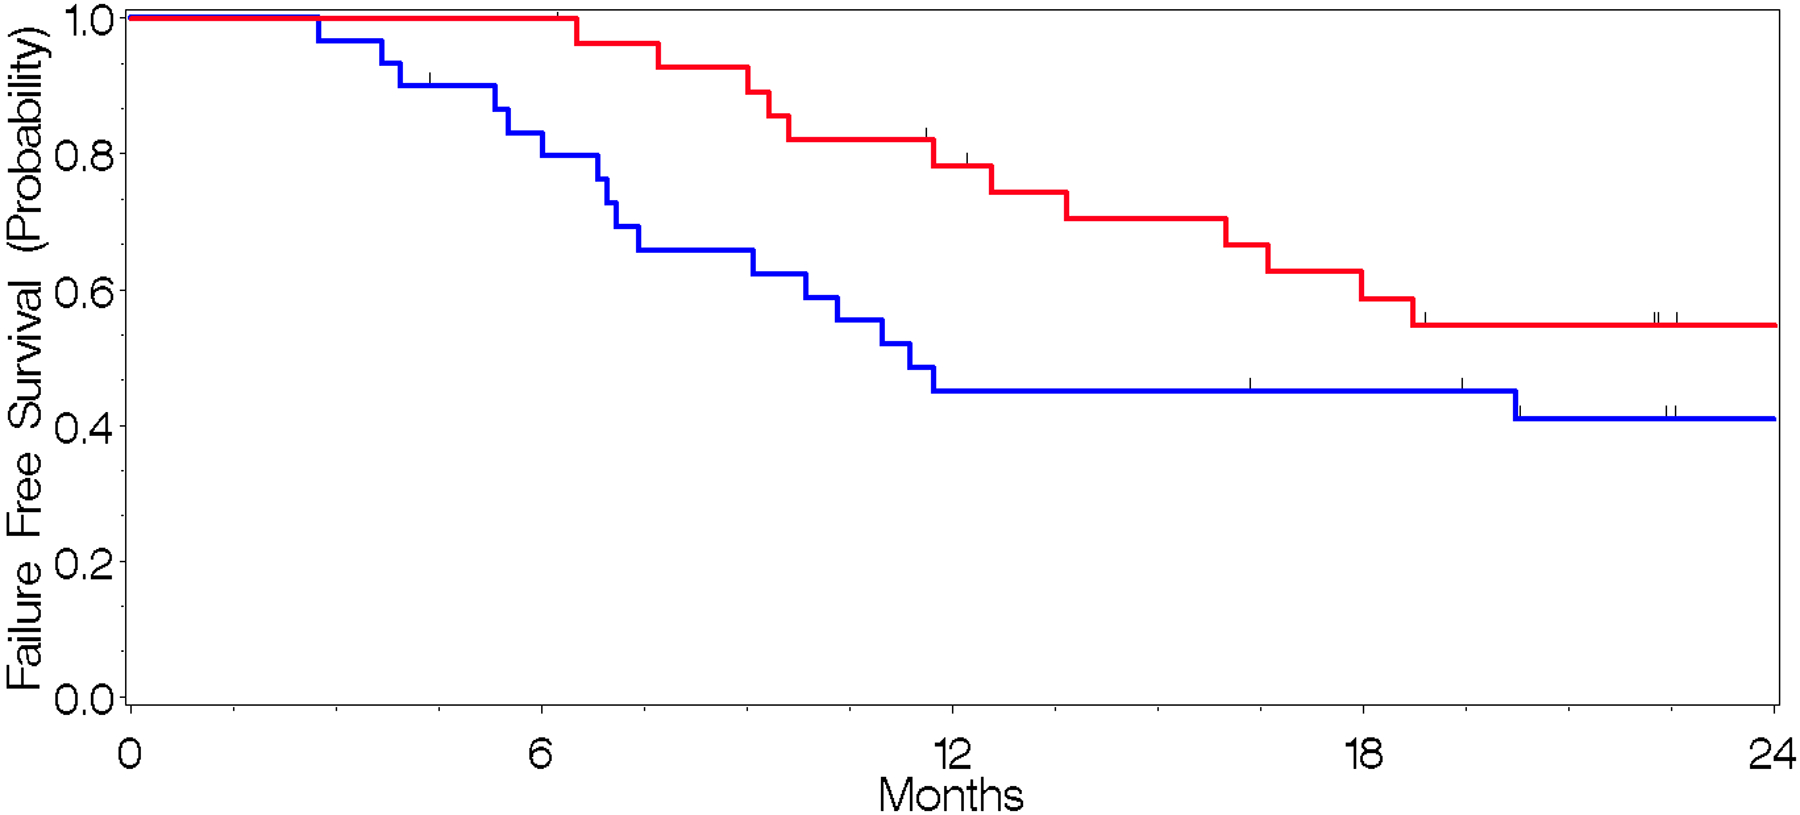
a. Time-to-Death (red) and Time-to-Progression (blue) across the entire cohort.
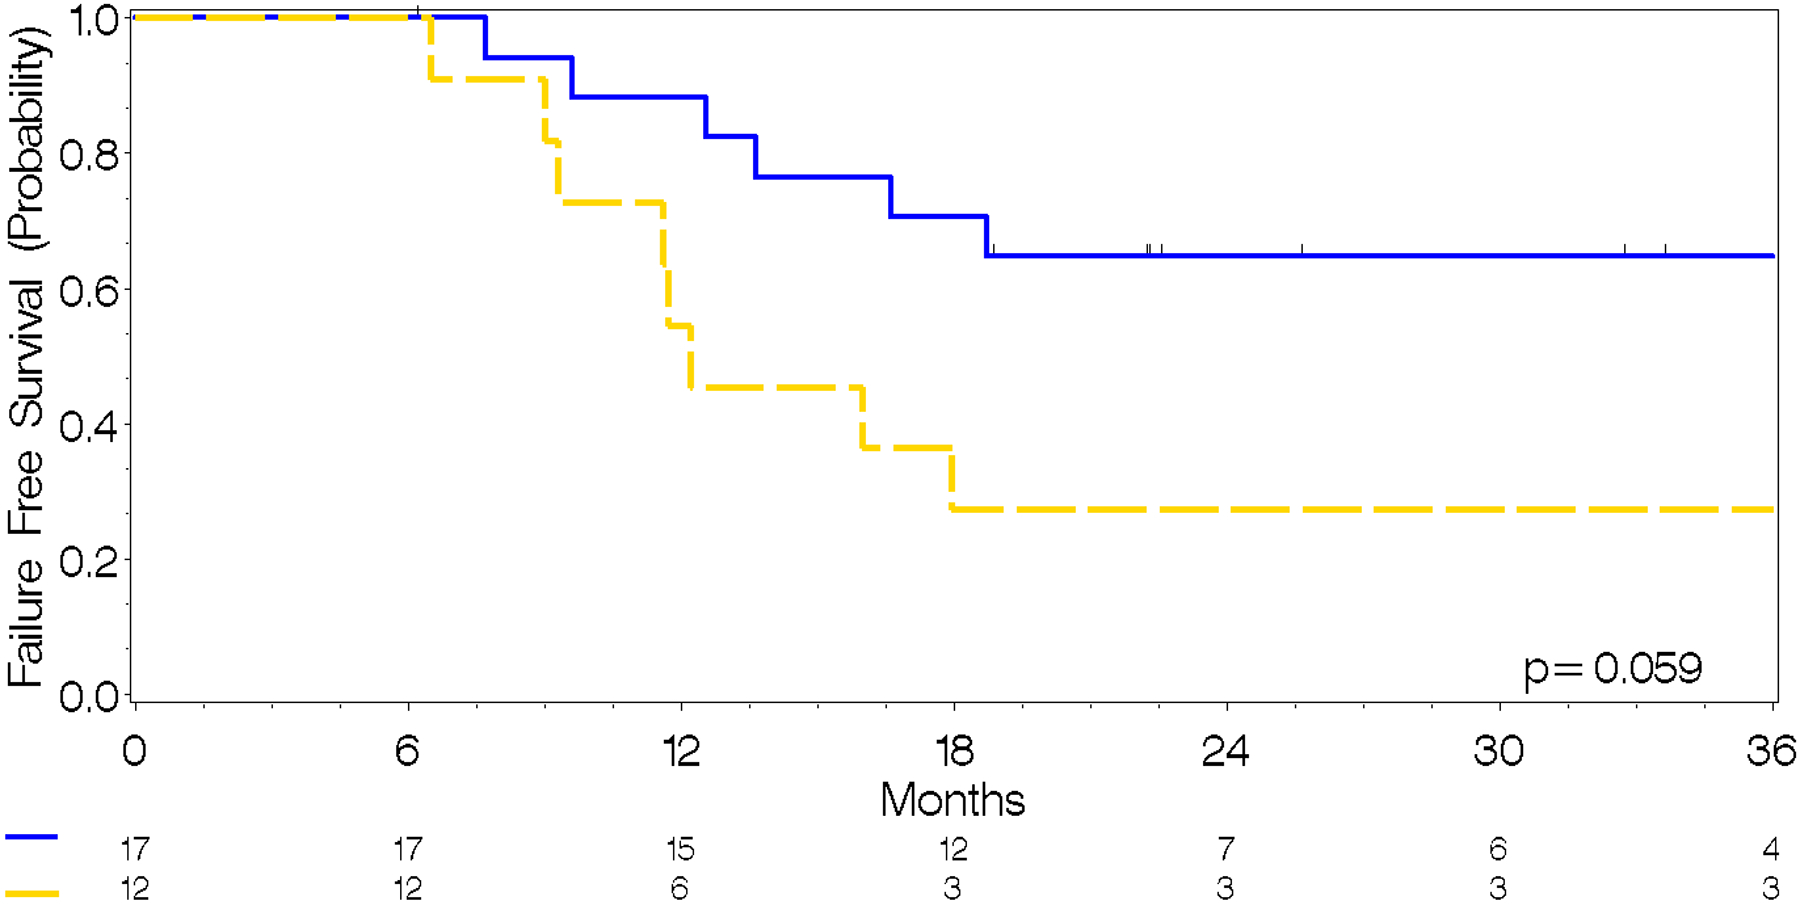
b. Time-to-Progression from MET-PET by proportion of non-contrast enhancing tumor, where Blue≤10% MET-PET avid tumor volume, Yellow≥10% MET-PET avid tumor volume. Low pNCET = 67.3 months (95% CI, 13.7–74.9) High pNCET = 12.2 months (95% CI, 9.0–58.1)
Statistical Analysis
Nonparametric summary statistics (median, interquartile range, and range) were generated for continuous measures. Ordinal and categorical data were summarized as count and frequency measures. Comparisons across nonparametric continuous data were completed using the Kruskal-Wallis test or 1-way analysis of variance (ANOVA) depending on the normality of the data. The Chi-square test was used to compare frequency data. Time-to-event data were summarized using the Kaplan-Meier method, and the log-rank test was used to test the difference between strata. A 2-tailed p value of less than 0.05 was considered to be statistically significant. Data were recorded using Microsoft Excel 2013 and analyzed using SAS v9.3.
Results
Patient and Treatment Characteristics
Thirty-one patients (median age, 10.5 years; age range, 1–23 years) were evaluated using either individual or serial MET-PET scans. Patient and treatment details are listed in Supplementary Table 1.
MET-PET Timing
MET-PET scans were most commonly completed at diagnosis, following resection, or at the time of treatment failure (Table 1). Six patients had MET-PET scans following resection; 3 of the 6 had MET-PET-delineated tumor volumes >5cc beyond the operative bed, which suggested possible residual tumor not delineated by T2 Flair, ADC, or T1+Gd abnormality. Two of the three with MET-PET–positive post-surgical scans experienced recurrence in <6 months.
Table 1.
MET-PET Scan Timing.
| Time point | No. scans (N = 62) | MET-PET (%) |
|---|---|---|
| At Diagnosis | 20 | 32 |
| Post Resection | 6 | 10 |
| Post Failure | 9 | 15 |
| Post Chemotherapy | 7 | 11 |
| Post Radiotherapy | 10 | 16 |
| Post Treatment Surveillence1 | 7 | 11 |
| Post Treatment Surveillence2 | 2 | 3 |
| Post Treatment Surveillence3 | 1 | 2 |
Abbreviations: RT = Radiation therapy,
No. MET-PET scans per patient: Median = 2; IQR: 1–2; Range: 1–5
Outcomes
At last follow-up, 46.6% of patients were alive. Progression had occurred in 64.5% of patients at last follow-up, with the median time from diagnosis to progression being 11.4 months (95% CI, 6.8–22.6) and that from radiotherapy to progression being 11.4 months (95% CI, 4.6–20.2) (Supplementary Table 2. Outcomes, Fig. 2). The median overall survival time from diagnosis was 18.8 months (95% CI, 11.7–34.1) and 15.2 months (95% CI, 8.8–29.7) from radiotherapy.
MRI–MET-PET Coincidence
Tumor and resection bed abnormalities were delineated according to MET-PET, T1+Gd, T2-FLAIR, and ADC results across all 62 MET-PET scans. The tumor was segmented volumetrically on each scan according to each image sequence abnormalities. The MET-PET and T1Gd scans showed the greatest concordance in tumor volume estimation (Supplementary Table 3). The most discordant MR-MET-PET–segmented volumes were T2-Flair-MET-PET; the greatest concordance between MR volumes were between T2 Flair and ADC abnormality (Fig. 3). MET-PET infrequently delineated a unique volume of tumor beyond the region identified on the T2-Flair tumor volume (Fig. 3). MET-PET delineated a >5cc region of NCET in 29 of 62 scans.
Fig. 3.
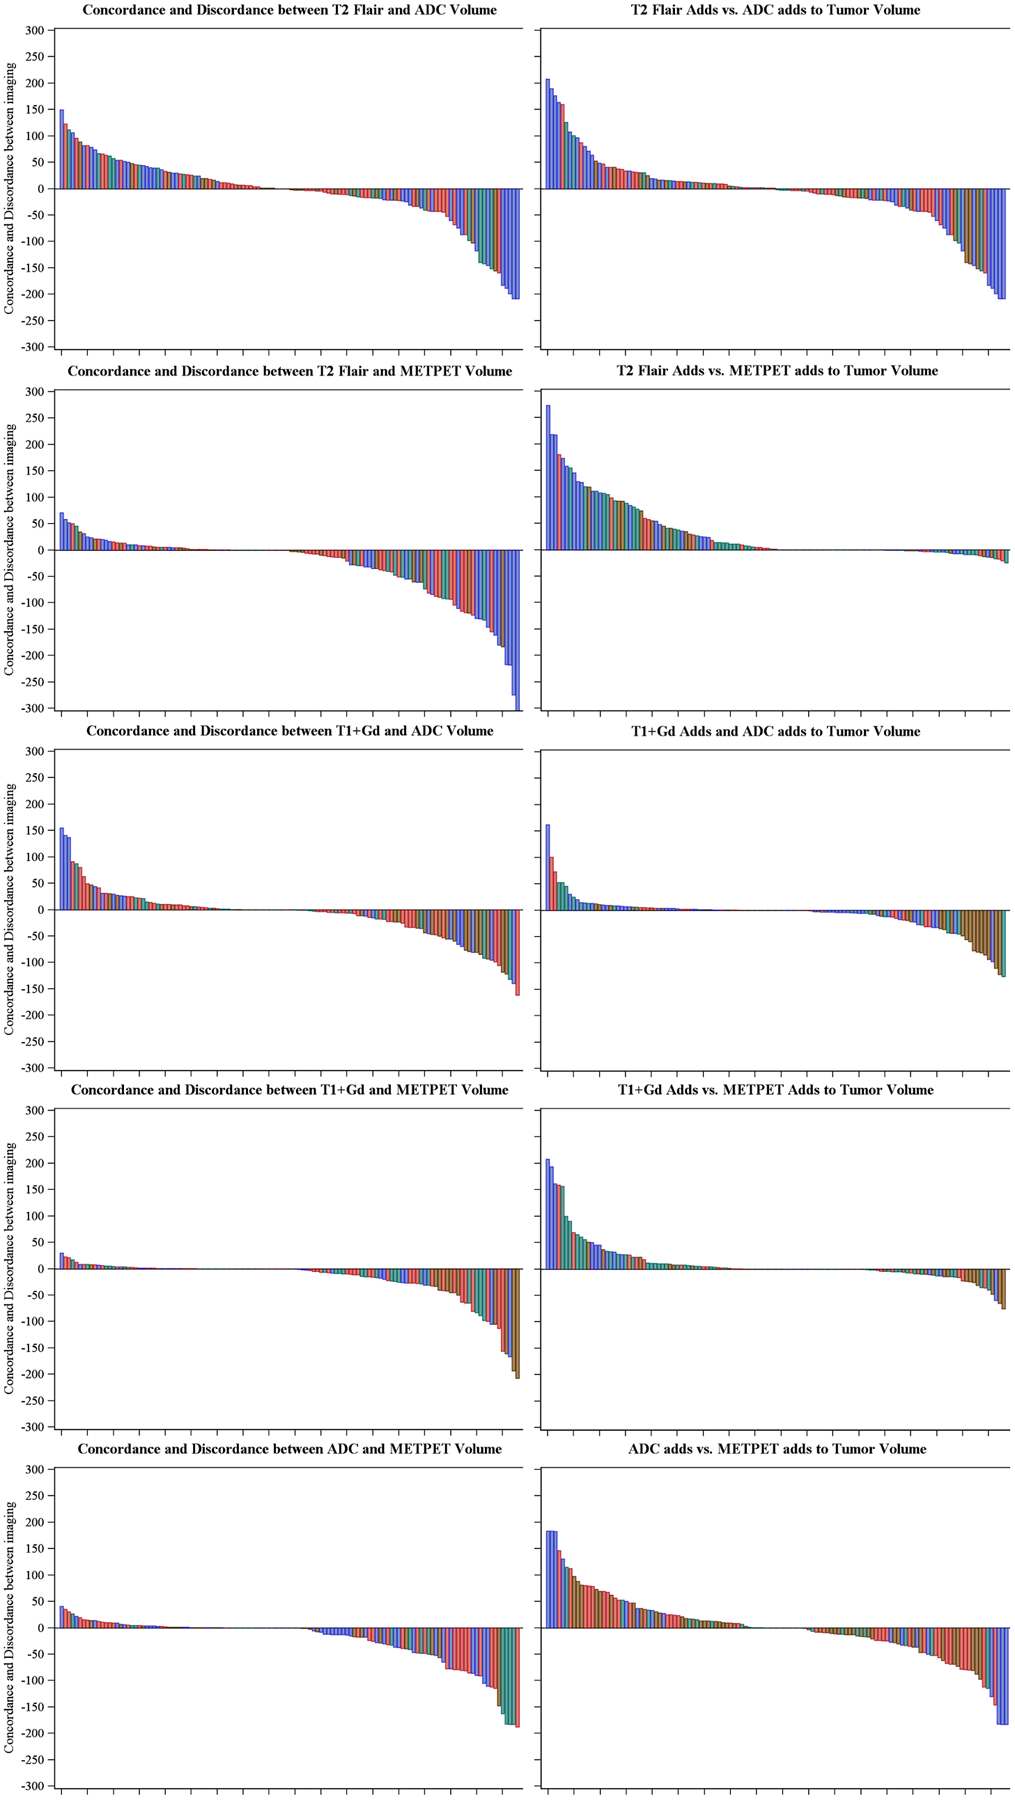
Waterfall plots illustrating concordance between each imaging sequence/modality and its corresponding contributions to defining tumor volume according to the extent of resection. Positive and negative values in the waterfall plots indicate concordance and discordance, respectively. Positive and negative values in the adjacent column of waterfall plots indicate the corresponding addition of each modality to tumor volume among discordant tumor volume. Blue = Biopsy only, Brown = Subtotal resection, Green = Near-total resection, Red = Gross total resection. y-Axis = Volume in milliliters, x-Axis = Sorted scan list. ADC = Apparent diffusion coefficient, T1+Gd = T1-weighted imaging with gadolinium contrast, T2 = T2-weighted imaging
Brain Region Involved by Tumor
The most commonly involved areas of the brain, as delineated by T2-Flair and T1+Gd, were the brainstem and midbrain (Supplementary Table 4).
Description of MET-PET SUV – Tumor Volume per Time point
The proportion of patients with a specified percentage of tumor volume greater than or equal to each SUV range is specified for each time point (Fig. 4). Post treatment SUV-volume values increased proportionally from diagnosis in the SUV range of 3–4.9, while there was a corresponding decrease in the proportion in the SUV 0–2.9 range. Correspondingly, a net decrease in the proportion of patients occurred across most SUV-volume categories, consistent with a decrease in net activity the further the patient was from treatment. Similarly, MET-PET scans of recurrent disease had uniformly higher SUV-volume values than did those of patients undergoing routine surveillance. The initial MET-PET region overlapped with recurrent tumor identified on the MRI in 90% of the cases. The percent tumor volume greater than an SUV of 3 was significantly different post treatment vs. other time points (p<0.05) (Supplementary Table 5). Differences in SUV across different treatment types (radiotherapy vs. chemotherapy vs. chemo radiotherapy) could not be assessed due to sample size.
Fig. 4.
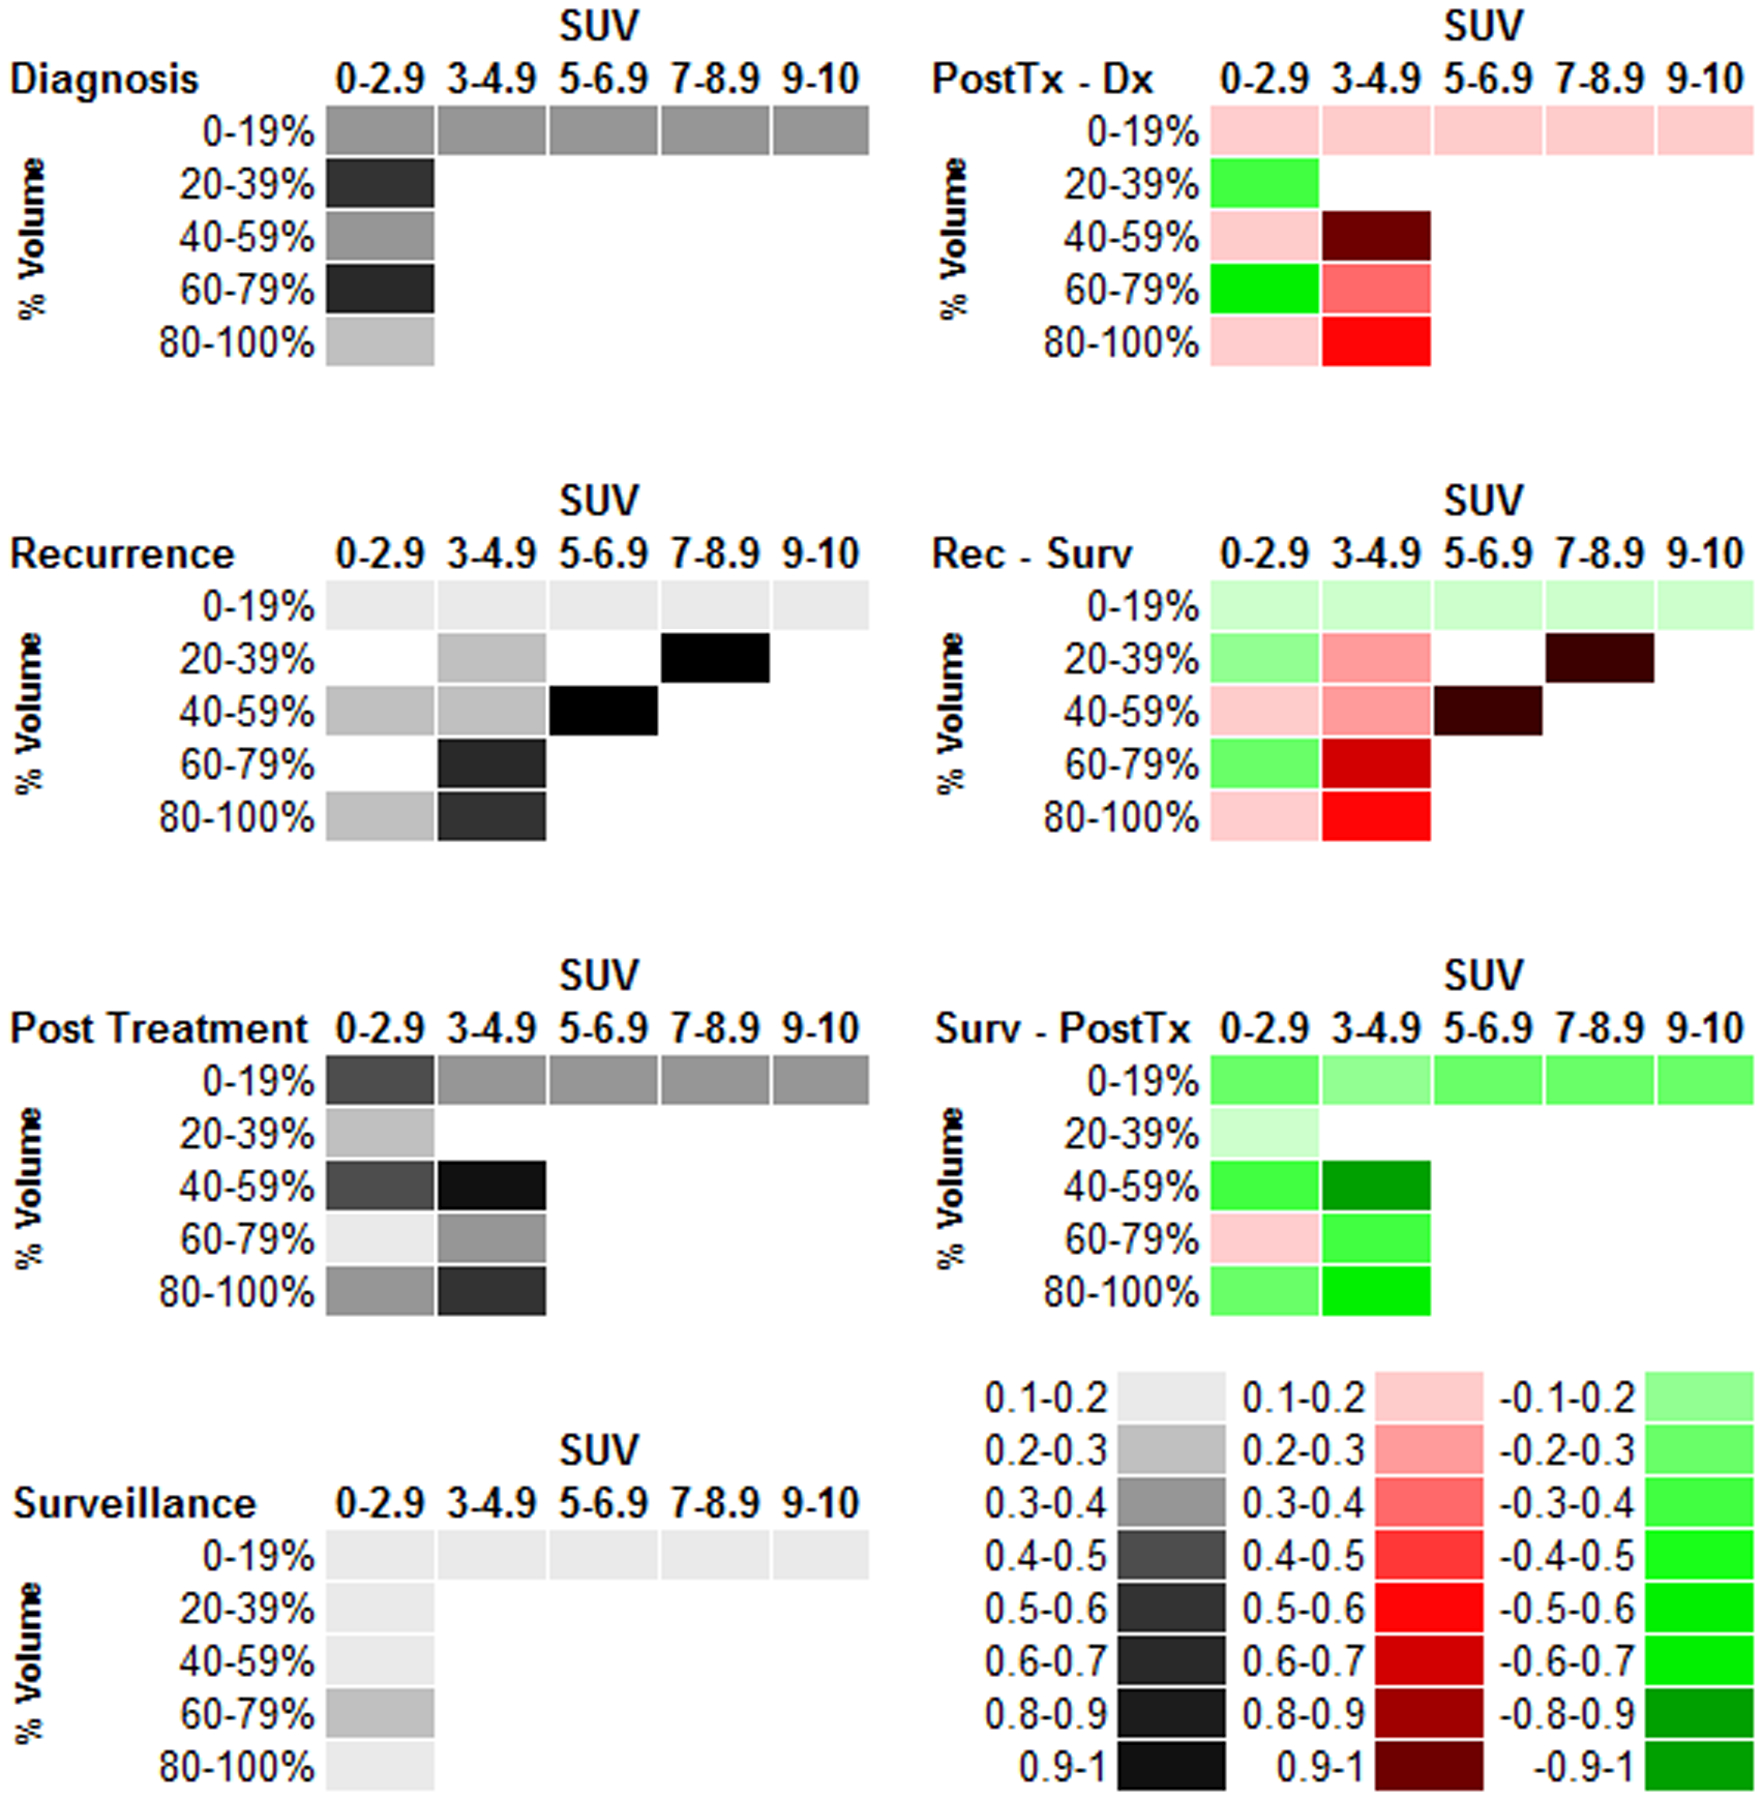
Descriptive analysis of tumor volume – Standardized uptake value proportions at each time point. The proportion of the tumor volume (row labels) with an SUV greater than or equal to the specified SUV range (column header). The descriptive plots for each time point are in the left hand column while the matrix subtraction of the volume-SUV proportions from each cell are displayed in the right-hand column. In the right column, progressively darker red values indicate an increase relative to the time point specified while progressively darker green values indicate a decrease. Colorimetric scale for the left- and right-hand columns is in the bottom left corner. PostTx = Post-treatment, Dx = Diagnosis, Rec = Recurrence, Surv = Surveillance, SUV = Standardized uptake value
Prognostic Significance of MET-PET–delineated Non-contrast Enhanced Tumor
The proportion of NCET was calculated for each MET-PET scan. The time from the at diagnosis scan to progression in patients without prior progression was calculated and is summarized in Figure 2. Patients with more than 10% NCET had a statistically significant increase in the hazard for progression relative to those with a pNCET <10% (HR 4.1, p=0.03) and a shorter time to progression 12.2 months 95% CI 9.0–45.1 vs. 67.3 months 95% CI 13.7–74.9. Similarly, those with a pNCET >10% at diagnosis had an increased hazard for death relative to those with a pNCET <10% although this was not statistically significant (HR 3.8, p=0.07). Immediate post treatment scans were not prognostic for progression or death (not shown).
Discussion
MET-PET is useful for assessing adult HGGs. Because the cellular needs of malignant tissue are disproportionate to those of normal tissue, MET-PET has shown promise in accurately delineating the boundaries of tumors [7, 12–14]. Others suggest that MET uptake also has a role in prognostic assessment although the exact contexts in which this holds true are not well defined [5].
MET-PET may be more influential in pediatric HGG than in adult HGG, given that grade assessment is difficult due to the lack of key features that can indicate grade (more frequent lack of contrast enhancement, uncommon calcifications in low-grade pediatric glioma) [15]. The differential imaging features of adult and pediatric gliomas are highlighted by recent literature showing divergent genetic underpinnings to the diseases and resultant different biological phenotypes. Further studies will be needed to understand the relevance of MET uptake in pediatric glioma to the underlying metabolic phenotype.
Our review of segmented MR image abnormalities illustrates the divergent regions of glioma and highlights the role that MET uptake may play in delineating distinctive regions having a unique biologic phenotype. MET uptake has been connected to the cellularity of recurrence over the presence of necrosis in HGG, both frequently suspected following treatment and difficult to differentiate based on MR alone [16]. Low ADC signal has also been suggested as a means of detecting high-cellularity regions of tumor [17]. We noted discordance between many MET-PET-positive areas and ADC abnormalities, illustrating the potential inaccuracies of relying on MR only–based methods to delineate tumor cell density.
Regions of intense amino-acid uptake have been connected with impaired prognosis in adult gliomas [18]. Non-contrast enhancing regions delineated by perfusion imaging have been noted to be markers for an unfavorable prognosis in adult HGG [4]. In our series, an increasing proportion of tumor defined as NCET portended a worsened prognosis. These confirmatory findings suggest a potential role of METPET in revealing regions of neo-angiogenesis which has a plausible biological role in contributing adversely to the poor prognosis seen across reports. Furthermore, the absence of IDH1 or IDH2 mutations has been connected to a shift toward using alternative energy sources, including branched-chain amino acids [19]. In fact, Branched Chain Amino-Acid Transaminase 1 expression depends on IDH1 function [20]. Thus, while not confirmed in this analysis, increased MET uptake may be a surrogate of non–IDH-mutated gliomas which have increased potential for neo-angiogenesis.
Conclusion
MET-PET delineates regions at increased risk for recurrence and may improve the definition of failure, prognostic assessment, and target definition for radiotherapy. Prospective protocols using MET-PET in a uniformly treated cohort of patients will be needed for further evaluation.
Supplementary Material
Acknowledgments
The authors thank Tina Davis and Roletta Ammons for their help with manuscript preparation, Cherise Guess for her help with manuscript review and Beth Lovorn for her assistance with protocol management and trial enrollment, accrual, and administration.
Footnotes
Conflict of Interest: The authors declare that they have no conflict of interest.
Ethical approval: All procedures performed in studies involving human participants were in accordance with the ethical standards of the institutional and/or national research committee and with the 1964 Helsinki declaration and its later amendments or comparable ethical standards.
Informed consent: Informed consent was obtained from all individual participants included in the study.
REFERENCES
- 1.Chen W (2007) Clinical applications of PET in brain tumors. J Nucl Med 48: 1468–1481 doi: 10.2967/jnumed.106.037689 [DOI] [PubMed] [Google Scholar]
- 2.Reardon DA, Gajjar A, Sanford RA, Heideman RL, Walter AW, Thompson SJ, Merchant TE, Li H, Jenkins JJ, Langston J, Boyett JM, Kun LE (1998) Bithalamic involvement predicts poor outcome among children with thalamic glial tumors. Pediatr Neurosurg 29: 29–35 [DOI] [PubMed] [Google Scholar]
- 3.Jain R, Poisson LM, Gutman D, Scarpace L, Hwang SN, Holder CA, Wintermark M, Rao A, Colen RR, Kirby J, Freymann J, Jaffe CC, Mikkelsen T, Flanders A (2014) Outcome prediction in patients with glioblastoma by using imaging, clinical, and genomic biomarkers: focus on the nonenhancing component of the tumor. Radiology 272: 484–493 doi: 10.1148/radiol.14131691 [DOI] [PMC free article] [PubMed] [Google Scholar]
- 4.Stockhammer F, Plotkin M, Amthauer H, van Landeghem FK, Woiciechowsky C (2008) Correlation of F-18-fluoro-ethyl-tyrosin uptake with vascular and cell density in non-contrast-enhancing gliomas. J Neurooncol 88: 205–210 doi: 10.1007/s11060-008-9551-3 [DOI] [PubMed] [Google Scholar]
- 5.Singhal T, Narayanan TK, Jacobs MP, Bal C, Mantil JC (2012) 11C-methionine PET for grading and prognostication in gliomas: a comparison study with 18F-FDG PET and contrast enhancement on MRI. J Nucl Med 53: 1709–1715 doi: 10.2967/jnumed.111.102533 [DOI] [PubMed] [Google Scholar]
- 6.Iuchi T, Hatano K, Uchino Y, Itami M, Hasegawa Y, Kawasaki K, Sakaida T, Hara R (2015) Methionine Uptake and Required Radiation Dose to Control Glioblastoma. Int J Radiat Oncol Biol Phys 93: 133–140 doi: 10.1016/j.ijrobp.2015.04.044 [DOI] [PubMed] [Google Scholar]
- 7.Goldman S, Levivier M, Pirotte B, Brucher JM, Wikler D, Damhaut P, Dethy S, Brotchi J, Hildebrand J (1997) Regional methionine and glucose uptake in high-grade gliomas: a comparative study on PET-guided stereotactic biopsy. J Nucl Med 38: 1459–1462 [PubMed] [Google Scholar]
- 8.Iuchi T, Hatano K, Narita Y, Kodama T, Yamaki T, Osato K (2006) Hypofractionated high-dose irradiation for the treatment of malignant astrocytomas using simultaneous integrated boost technique by IMRT. Int J Radiat Oncol Biol Phys 64: 1317–1324 doi: 10.1016/j.ijrobp.2005.12.005 [DOI] [PubMed] [Google Scholar]
- 9.Tsien CI, Brown D, Normolle D, Schipper M, Piert M, Junck L, Heth J, Gomez-Hassan D, Ten Haken RK, Chenevert T, Cao Y, Lawrence T (2012) Concurrent temozolomide and dose-escalated intensity-modulated radiation therapy in newly diagnosed glioblastoma. Clin Cancer Res 18: 273–279 doi: 10.1158/1078-0432.CCR-11-2073 [DOI] [PMC free article] [PubMed] [Google Scholar]
- 10.Vavere AL, Snyder SE (2012) Synthesis of L-[methyl-11C] methionine (11C-MET). In: Scott PJ, Hockley B (eds) Radiochemical Syntheses. John Wiley & Sons, New York, NY, pp 199–212 [Google Scholar]
- 11.Lapa C, Linsenmann T, Monoranu CM, Samnick S, Buck AK, Bluemel C, Czernin J, Kessler AF, Homola GA, Ernestus RI, Lohr M, Herrmann K (2014) Comparison of the amino acid tracers 18F-FET and 18F-DOPA in high-grade glioma patients. J Nucl Med 55: 1611–1616 doi: 10.2967/jnumed.114.140608 [DOI] [PubMed] [Google Scholar]
- 12.Kaschten B, Stevenaert A, Sadzot B, Deprez M, Degueldre C, Del Fiore G, Luxen A, Reznik M (1998) Preoperative evaluation of 54 gliomas by PET with fluorine-18-fluorodeoxyglucose and/or carbon-11-methionine. J Nucl Med 39: 778–785 [PubMed] [Google Scholar]
- 13.Massager N, David P, Goldman S, Pirotte B, Wikler D, Salmon I, Nagy N, Brotchi J, Levivier M (2000) Combined magnetic resonance imaging- and positron emission tomography-guided stereotactic biopsy in brainstem mass lesions: diagnostic yield in a series of 30 patients. J Neurosurg 93: 951–957 doi: 10.3171/jns.2000.93.6.0951 [DOI] [PubMed] [Google Scholar]
- 14.Pirotte B, Goldman S, Dewitte O, Massager N, Wikler D, Lefranc F, Ben Taib NO, Rorive S, David P, Brotchi J, Levivier M (2006) Integrated positron emission tomography and magnetic resonance imaging-guided resection of brain tumors: a report of 103 consecutive procedures. J Neurosurg 104: 238–253 doi: 10.3171/jns.2006.104.2.238 [DOI] [PubMed] [Google Scholar]
- 15.Borja MJ, Plaza MJ, Altman N, Saigal G (2013) Conventional and advanced MRI features of pediatric intracranial tumors: supratentorial tumors. AJR Am J Roentgenol 200: W483–503 doi: 10.2214/AJR.12.9724 [DOI] [PubMed] [Google Scholar]
- 16.Tsuyuguchi N, Sunada I, Iwai Y, Yamanaka K, Tanaka K, Takami T, Otsuka Y, Sakamoto S, Ohata K, Goto T, Hara M (2003) Methionine positron emission tomography of recurrent metastatic brain tumor and radiation necrosis after stereotactic radiosurgery: is a differential diagnosis possible? J Neurosurg 98: 1056–1064 doi: 10.3171/jns.2003.98.5.1056 [DOI] [PubMed] [Google Scholar]
- 17.Pramanik PP, Parmar HA, Mammoser AG, Junck LR, Kim MM, Tsien CI, Lawrence TS, Cao Y (2015) Hypercellularity Components of Glioblastoma Identified by High b-Value Diffusion-Weighted Imaging. Int J Radiat Oncol Biol Phys 92: 811–819 doi: 10.1016/j.ijrobp.2015.02.058 [DOI] [PMC free article] [PubMed] [Google Scholar]
- 18.Lee IH, Piert M, Gomez-Hassan D, Junck L, Rogers L, Hayman J, Ten Haken RK, Lawrence TS, Cao Y, Tsien C (2009) Association of 11C-methionine PET uptake with site of failure after concurrent temozolomide and radiation for primary glioblastoma multiforme. Int J Radiat Oncol Biol Phys 73: 479–485 doi: 10.1016/j.ijrobp.2008.04.050 [DOI] [PMC free article] [PubMed] [Google Scholar]
- 19.Mayers JR, Vander Heiden MG (2013) BCAT1 defines gliomas by IDH status. Nature medicine 19: 816–817 doi: 10.1038/nm.3263 [DOI] [PubMed] [Google Scholar]
- 20.Tonjes M, Barbus S, Park YJ, Wang W, Schlotter M, Lindroth AM, Pleier SV, Bai AH, Karra D, Piro RM, Felsberg J, Addington A, Lemke D, Weibrecht I, Hovestadt V, Rolli CG, Campos B, Turcan S, Sturm D, Witt H, Chan TA, Herold-Mende C, Kemkemer R, Konig R, Schmidt K, Hull WE, Pfister SM, Jugold M, Hutson SM, Plass C, Okun JG, Reifenberger G, Lichter P, Radlwimmer B (2013) BCAT1 promotes cell proliferation through amino acid catabolism in gliomas carrying wild-type IDH1. Nature medicine 19: 901–908 doi: 10.1038/nm.3217 [DOI] [PMC free article] [PubMed] [Google Scholar]
Associated Data
This section collects any data citations, data availability statements, or supplementary materials included in this article.


