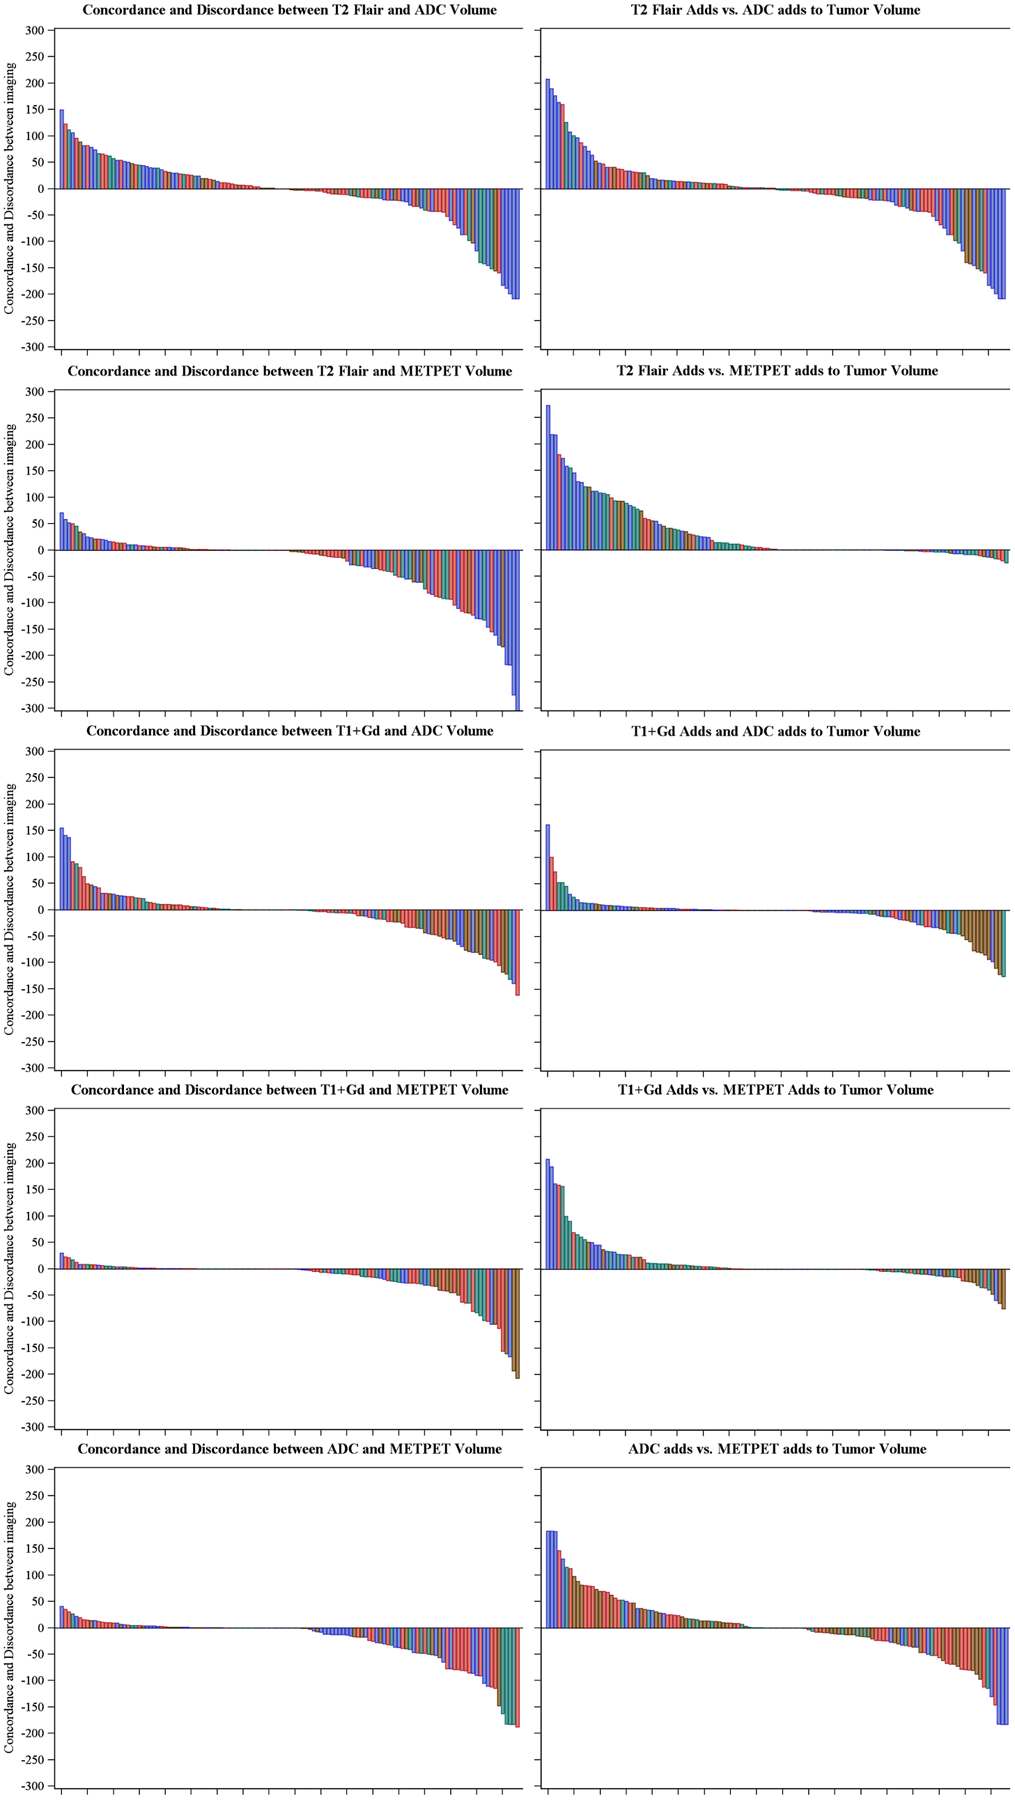
Fig. 3.

Waterfall plots illustrating concordance between each imaging sequence/modality and its corresponding contributions to defining tumor volume according to the extent of resection. Positive and negative values in the waterfall plots indicate concordance and discordance, respectively. Positive and negative values in the adjacent column of waterfall plots indicate the corresponding addition of each modality to tumor volume among discordant tumor volume. Blue = Biopsy only, Brown = Subtotal resection, Green = Near-total resection, Red = Gross total resection. y-Axis = Volume in milliliters, x-Axis = Sorted scan list. ADC = Apparent diffusion coefficient, T1+Gd = T1-weighted imaging with gadolinium contrast, T2 = T2-weighted imaging
