
FIGURE 4.
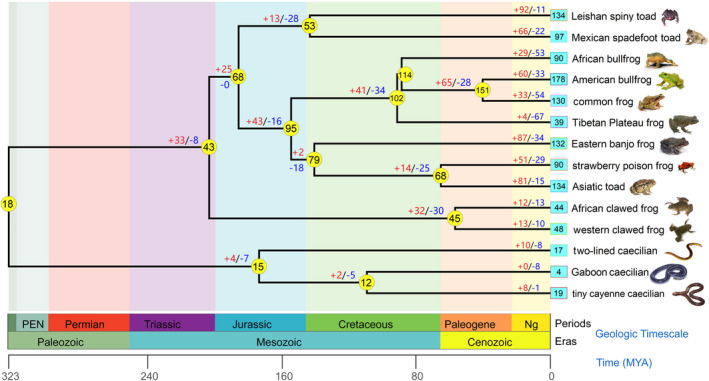
Evolutionary trajectories of amphibian Tas2r gene repertoires. The numbers in circles and boxes denote the number of intact Tas2rs. The numbers on branches denote gene increases (+; caused by gene duplication) and decreases (−; caused by gene deletion). For example, Leishan spiny toad gained 92 Tas2rs and lost 11 Tas2rs after branching off from its common ancestor with the Mexican spadefoot toad. The phylogenetic relationships and divergence times of these species were referred to TimeTree (Hedges et al., 2006)